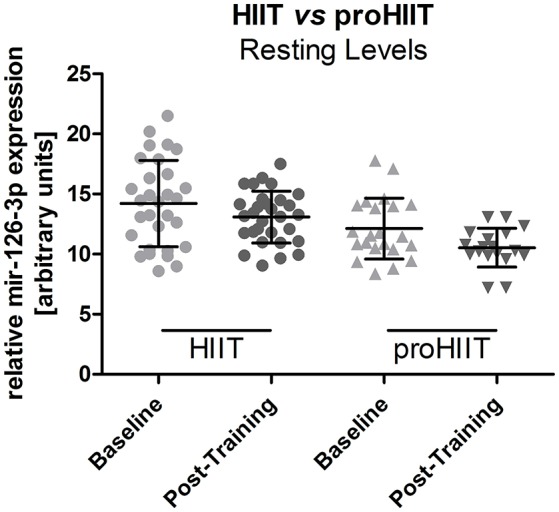
Figure 4.

Resting miR-126-3p levels in the HIIT and proHIIT group. No significant difference between resting miR-126-3p levels was detected within each group (baseline vs. post-training; HIIT, n = 15; proHIIT n = 9). Data are represented as mean ± SD compared by ANOVA.
