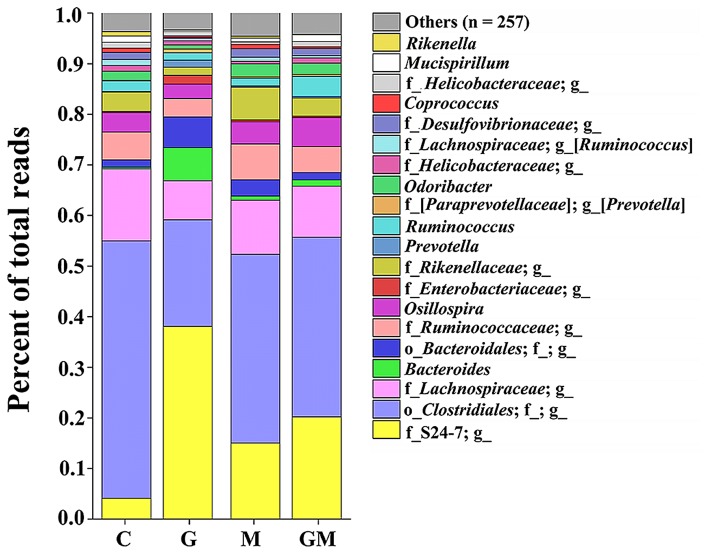
FIGURE 2.
Bacterial composition in the colonic digesta of mice from the four treatments. Each bar represents the average relative abundance of each bacterial taxon within a group. The top 20 most abundant taxa are shown. These taxa were observed with high relative abundance in the four groups, and comprise a relative abundance ranging from 95.4 to 96.7%. g, genus level; f, family level, o, order level. The underline followed by no annotation means no known taxonomic level was classified. C, control; G, glucan; M, MCC; GM, glucan and MCC.

