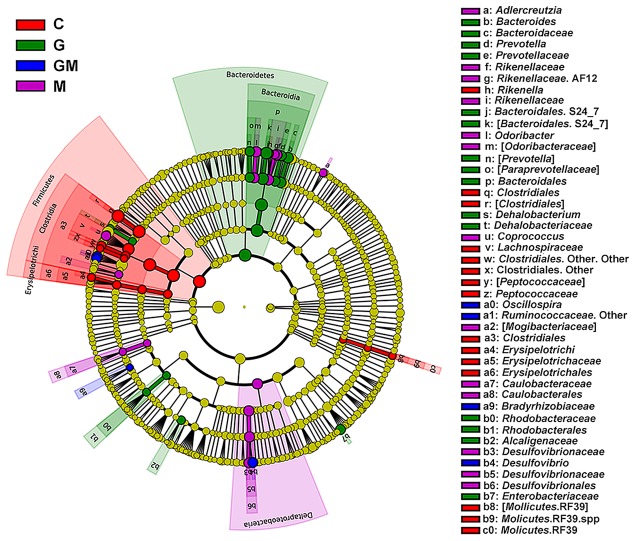
FIGURE 3.
Histogram of the linear discriminant analysis (LDA) scores computed for bacterial taxa differentially abundant among the four groups using default parameters. Six levels of the biomarkers (from phylum to genus) were shown in this figure. The circles radiating from inner to outside mean levels from phylum to genus. Small spots on each circle mean sub-classifications on the corresponding level, and the size of each spot is in proportion to the corresponding sub-classification. Sub-classifications with no differences among the treatments are colored with yellow, while biomarkers in each treatment are colored with different colors. A total of 53 differentially abundant bacterial taxa were detected. Of those, 17 taxa were significantly overrepresented in the colon of mice fed with oat-derived β-glucan (green), 14 taxa were overrepresented in mice fed with MCC (purple), 4 taxa were overrepresented in mice fed the mixture of the two fibers (blue), and 14 taxa were overrepresented in controlled mice (red). C, control; G, glucan; M, MCC; GM, glucan and MCC.

