
FIGURE 4.
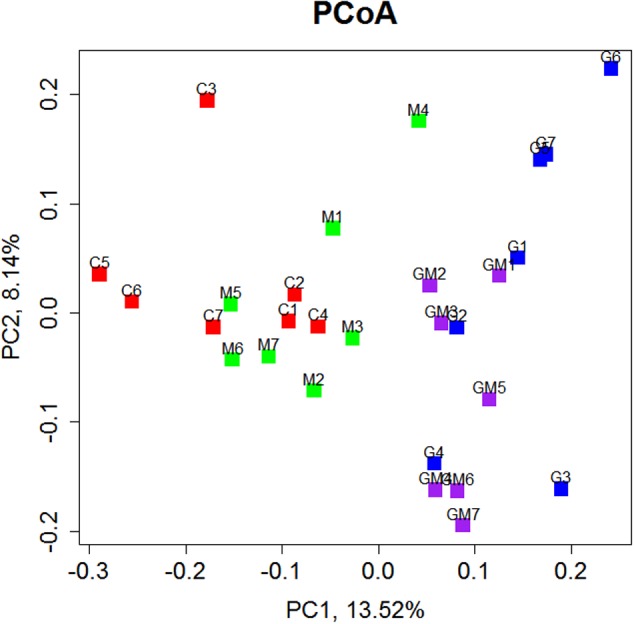
Principal Coordinate Analysis (PCoA) of bacterial community structures of the colonic microbiota of four experimental groups, each represented by one color. PCoA shows distinct bacterial communities for the four different treatments (p = 0.001). C, control; G, glucan; M, MCC; GM, glucan and MCC.