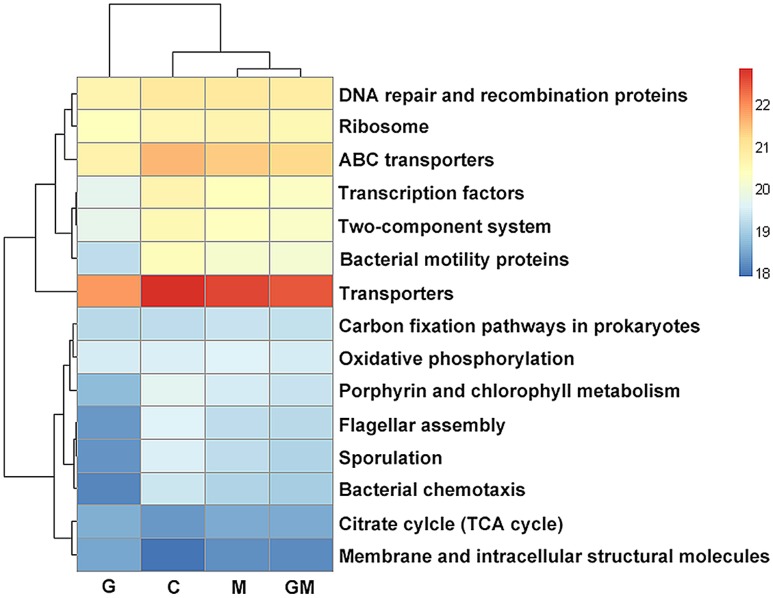
FIGURE 7.
Predicted function of colonic microbiota among mice in the four treatments. The gene copy numbers of samples within the same sample group were pooled. Values of each functional gene (row) were log10 transformed. All of the three levels of KEGG pathways are shown in the heatmap. Significance of differences in gene distribution among groups was tested using bootstrap Mann–Whitney U-test with cutoffs of p < 0.01, FDR < 0.1, Mean counts > 10. Genes with significance of differences among groups from 0.01 to 0.05 were not shown. C, control; G, glucan; M, MCC; GM, glucan and MCC.

