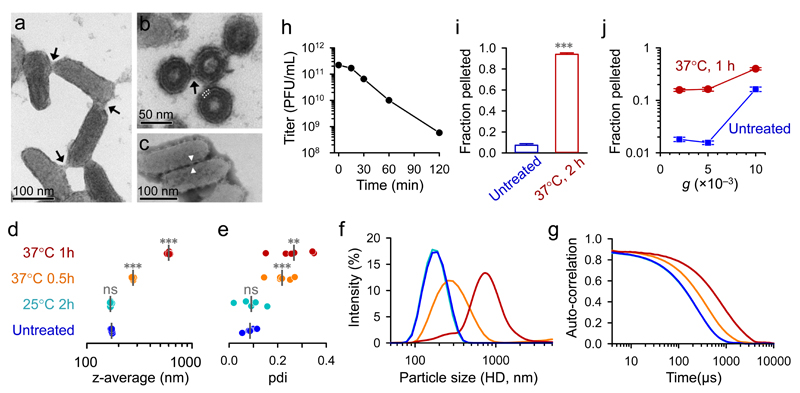
Fig. 1. Spontaneous aggregation of purified VSV virions.
Transmission electron micrographs of purified VSV virions (a-c), showing a virion suspension positively stained with uranyl acetate (a; arrows indicate contacts between virions), an ultrathin section of agar-encased virions (b; four virions are shown in trans section; the envelope bilayer is indicated with white dotted lines; the structure protruding from the envelope lipid bilayer, indicated with an arrow, probably corresponds to the envelope protein G), and a virion suspension negatively stained with phosphotungstic acid (c; the envelope protein is visible and appears to mediate virion-virion contacts, one of which is indicated). Additional micrographs are shown in Supplementary Fig. 1. Virions were subjected to DLS (d-g) by fixing virions immediately (untreated) or after incubation, as indicated. The z-average values obtained from six measurements are shown (d). Vertical grey lines indicate the mean z-average. Treatment effects were evaluated relative to the untreated group using t-tests (ns: P > 0.05; **: P < 0.01; ***: P < 0.001). e. Polydispersity indexes (pdi) obtained in the same set of measurements. Particle size distribution curves, expressed as the percentage total light scattering intensity (f) and raw auto-correlation data (g) are shown, where each curve is an average from the six measurements. h. Effect of aggregation on infectivity, as determined in BHK-21 cells by the plaque assay after incubating purified virions at 37°C for the indicated times. To assess PFU weight, virions were centrifuged directly (blue) or after 2 h incubation at 37°C (red), and the pellet and supernatant were titrated by the plaque assay (i; the pellet/supernatant titer ratio is represented). Pellet/supernatant titer ratios for increasing centrifugation forces (5 min spin) after incubating virions 1 h at 37°C are also shown (j). Error bars indicate the standard error of the mean from three assays.

