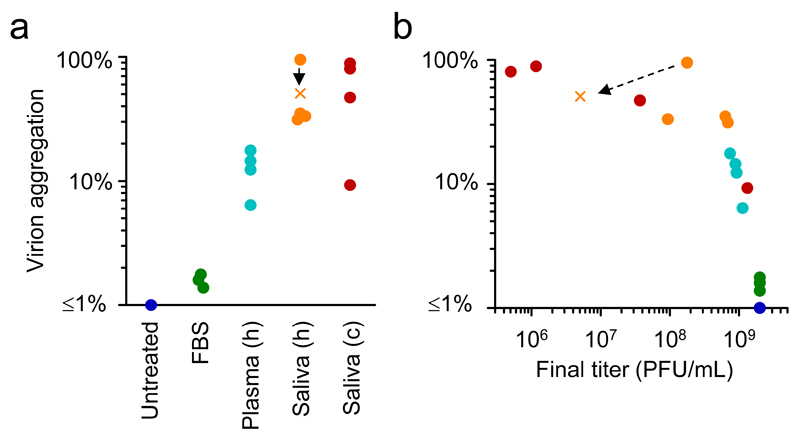
Fig. 4. VSV virion-virion binding in cell culture media, plasma, and saliva.
a. In each of the fluids tested, ca. 109 PFU/mL of each VSV-GFP and VSV-mCherry were co-incubated at 37°C for 2 h in FBS or human (h) plasma, 1 h in human saliva, or 15 min in cow (c) saliva, or not co-incubated (untreated). For one of the human salivas, the test was done both at 109 PFU/mL (circle) and 107 PFU/mL (cross). The amount of virion aggregation is represented as the fraction of virions forming dual PFUs estimated by the co-fluorescence test (see Methods and Supplementary Fig. 3; cell counts are available from Supplementary Table 1). For plasma and saliva, each data point corresponds to an individual donor (human/cow) and represents the average of two independent assays. For FBS, three independent assays are plotted. For untreated viruses, the estimated amount of virion aggregation fluctuated around zero (from –1.4% to 1.9% in six independent assays) and is shown as a single blue dot at the lower-limit of the plot range. b. Virion aggregation as a function of the final titer (i.e. after incubation), showing the correlation between titer loss and aggregation.

