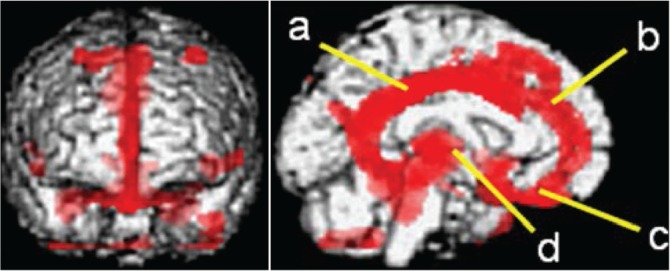
Fig. 6.

FDG-PET of a patient with diffuse axonal injury in the chronic phase (group analysis using SPM). Significant decrease of FDG metabolism (red areas, p < 0.001) can be seen in the cingulum (a), medial prefrontal region (b), frontal base (c), and thalamus (d) bilaterally compared to the normal control.
