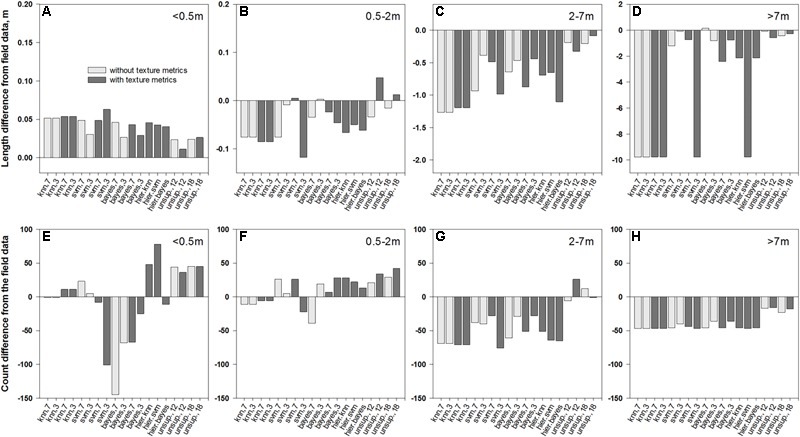
FIGURE 6.

Differences in average length of patch segments (A–D) and their counts (E–H) between field data and their intersections with medusahead classification outcomes summarized for different patch sizes: (A,E)<0.5 m; (B,F) 0.5–2 m; (C,G) 2–7 m; and (D,H) >7 m.
