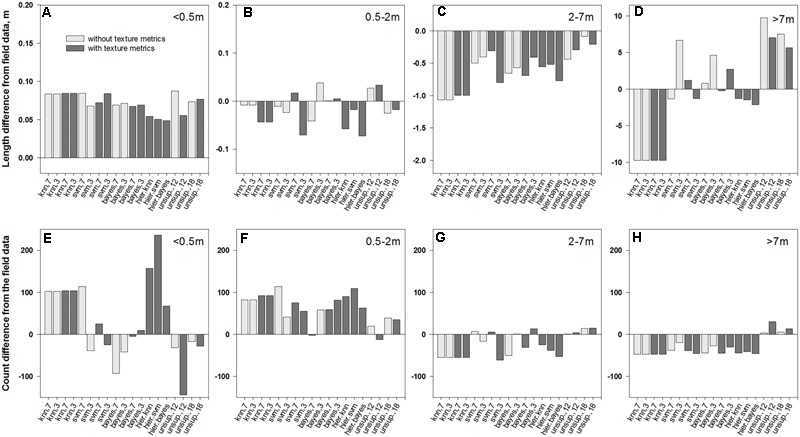
FIGURE 7.

Differences in average length of patch segments (A–D) and their counts (E–H) between field data and the intersections of medusahead classification outcomes with full transect lines summarized for different patch sizes: (A,E)<0.5 m; (B,F) 0.5–2 m; (C,G) 2–7 m; and (D,H) >7 m.
