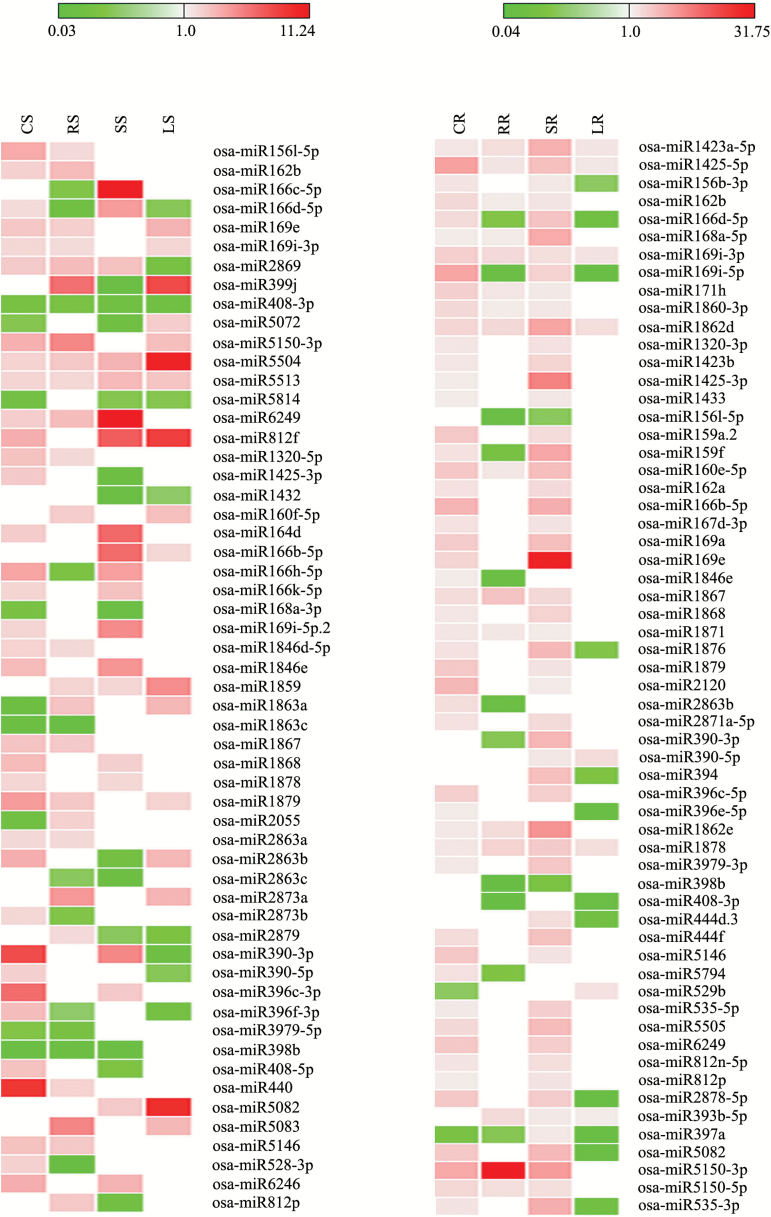
Fig. 5.
Heat map showing expression of miRNAs in heat tolerant N22 in comparison with heat susceptible Vandana (left side, shoot; right side, root). The comparison was made between two respective samples of N22 and Vandana. The gaps indicate no expression. The values shown in bars at the top indicate fold change regulation in N22 in comparison with Vandana. (This figure is available in color at JXB online.)

