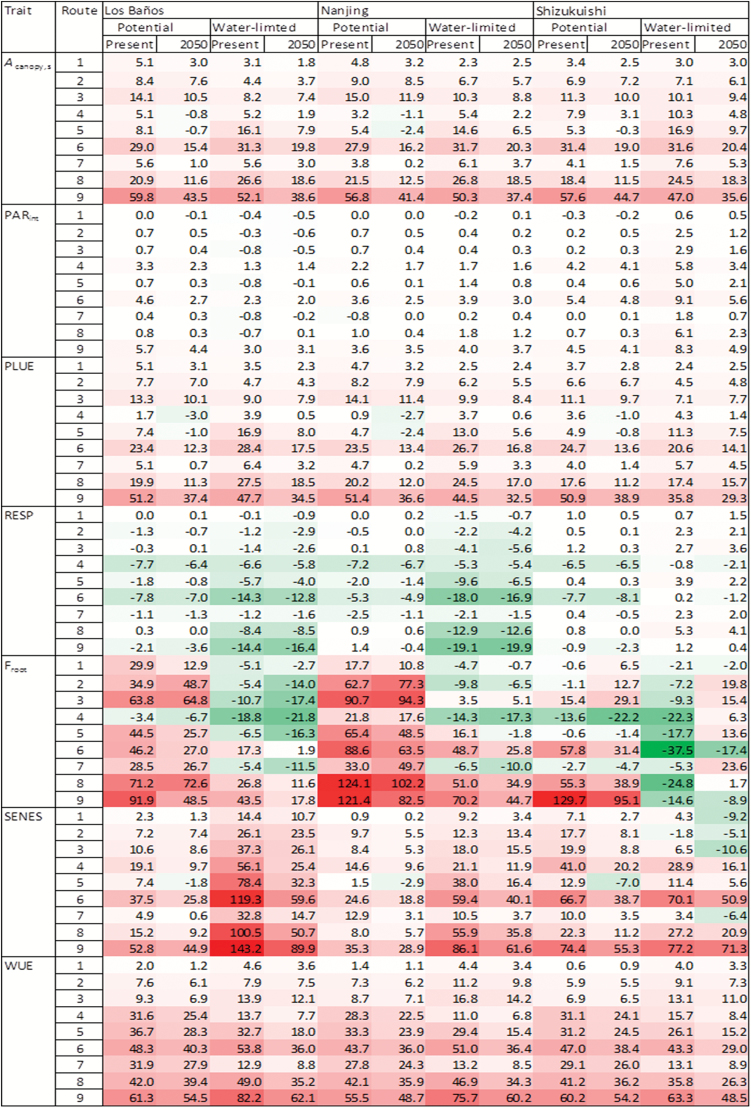
Fig. 3.
Heat map for the percentage change (%) of the 31 year average trait value for each of the nine photosynthesis-enhancing routes (route numbers defined in Table 2), relative to that for the default route, in a rice crop simulated for the present climate and the 2050 climate, under either potential or water-limited environments, at three representative sites. Traits shown are: Acanopy,s, season-long canopy photosynthesis; PARint, season-long intercepted PAR; PLUE, overall photosynthetic light use efficiency defined as Acanopy,s divided by PARint; RESP, season-long crop respiration; Froot, fraction of mass for roots; SENES, shoot mass lost due to leaf senescence; and WUE, water use efficiency. (Colours: white for no change, green for decrease, red for increase, and colour intensity for the magnitude of decrease or increase.)

