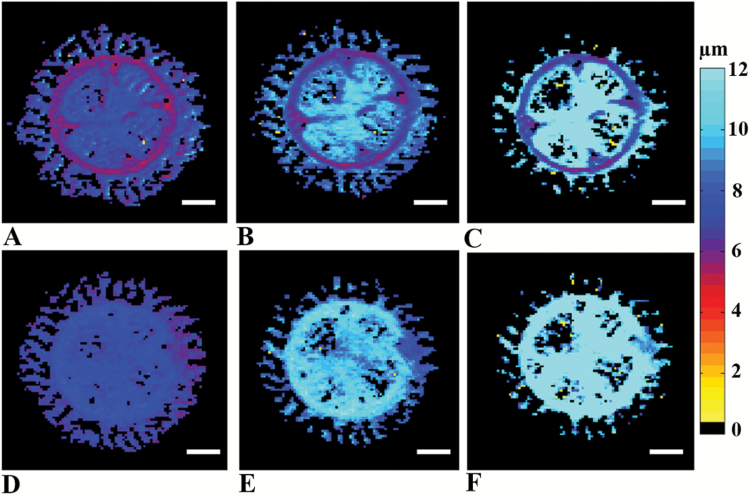
Fig. 4.
QSI-based images of tomato hypocotyls. Displacement maps of 5-week-old tomato hypocotyls extracted from high b-value QSI experiments performed in (A–C) the x-direction and (D–F) the z-direction, with three different diffusion times of (A, D) 15 ms, (B, E) 30 ms, and (C, F) 100 ms. Scale bars are 500 μm. (This figure is available in colour at JXB online.)

