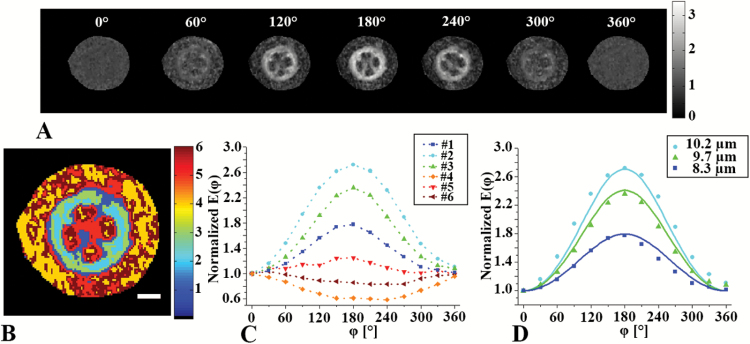
Fig. 5.
d-PGSE MRI analyses of tomato hypocotyls. (A) Raw data from the angular d-PGSE MRI experiment with zero mixing time conducted on 5-week-old tomato hypocotyls when φ was rotated in the x–y plane (i.e. perpendicular to the main axis of the plant). (B) k-means clustering analysis of the data presented in (A); The scale bar is 500 μm. (C) Normalized E(φ) profiles of the clusters shown in (B). (D) Normalized E(φ) profiles obtained from clusters in the vascular bundle region (symbols). Simulated curves are shows as lines for the indicated sizes. (This figure is available in colour at JXB online.)

