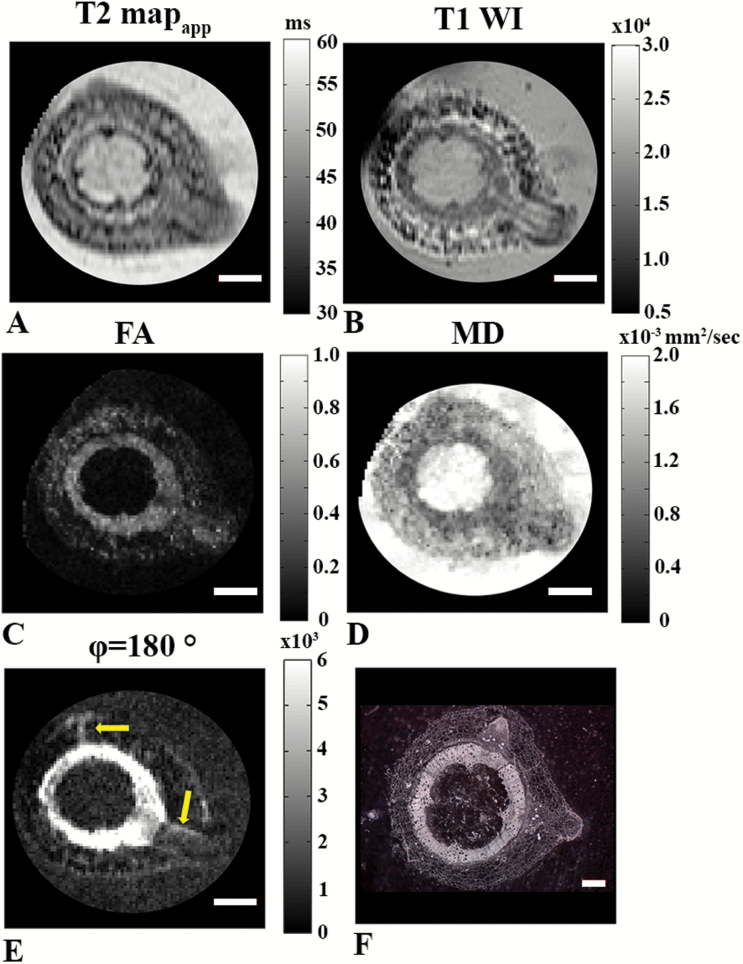
Fig. 6.
MR images obtained 24 h after adventitious root formation in 8-week-old plants (in-plane resolution of 68 µm2). (A) Apparent T2 map (TR/TE=3000/10–160). (B) T1-weighted image (TR/TE=700/15). (C) FA image. (D) MD image from DTI (b=1263 s mm–2, Δ=15 ms). (E) d-PGSE MR image for φ of 180°. Regions of small cells are indicated by the arrows. Scale bars in (A–E) are 1 mm. (F) Histological section at a slightly different location of the same hypocotyl; the scale bar is 500 µm.

