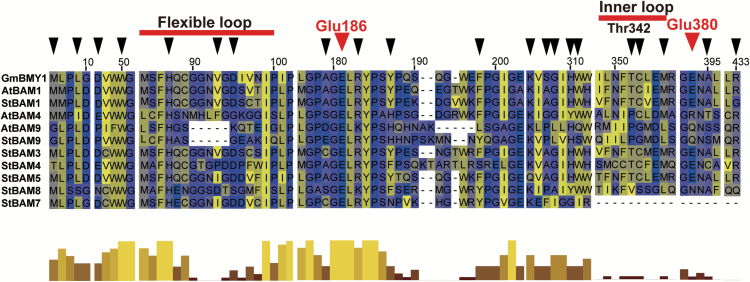
Fig. 3.
Alignment of the conserved glucosyl hydrolase domains from potato StBAMs, soybean GmBMY1, and Arabidopsis AtBAM1, AtBAM4, and AtBAM9. Most and same colour shading indicates identical residues and conservative substitutions for each column, whereas the less conserved residues are presented as a different colour. An overall picture of sequence conservation is displayed in the bar graph, together with tall yellow bars representing high sequence conservation and short brown bars representing low sequence conservation. Substrate binding sites and two catalytic residues are marked with black and larger red arrowheads, respectively. The deletion and substitution of the flexible loop and inner loop in StBAM9, AtBAM9, and AtBAM4 were indicated with red lines.

