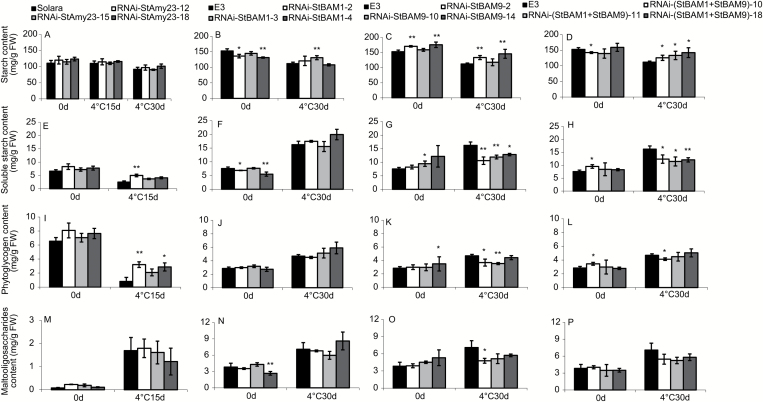
Fig. 8.
The starch content of RNAi-StAmy23, RNAi-StBAM1, RNAi-StBAM9 and RNAi-(StBAM1+StBAM9) tubers stored at 4 °C for 0, 15 and 30 d. (A–D) Starch content. (E–H) Soluble starch content. (I–L) Phytoglycogen content. (M–P) Malto-oligosaccharide content. The columns represent the mean values of three biological replicates and the bars indicate the standard deviation. *P < 0.05, **P < 0.01 by Student’s t test.

