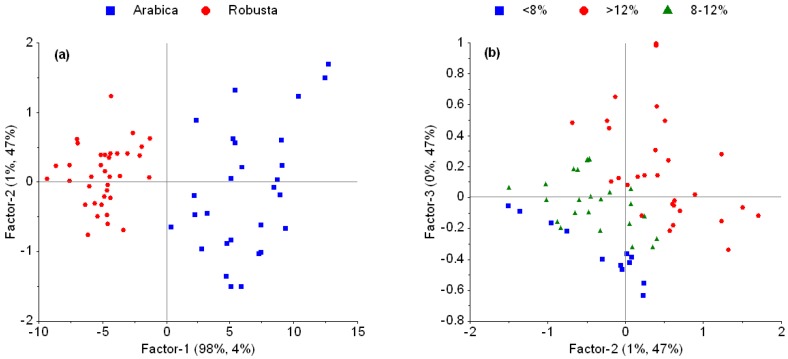
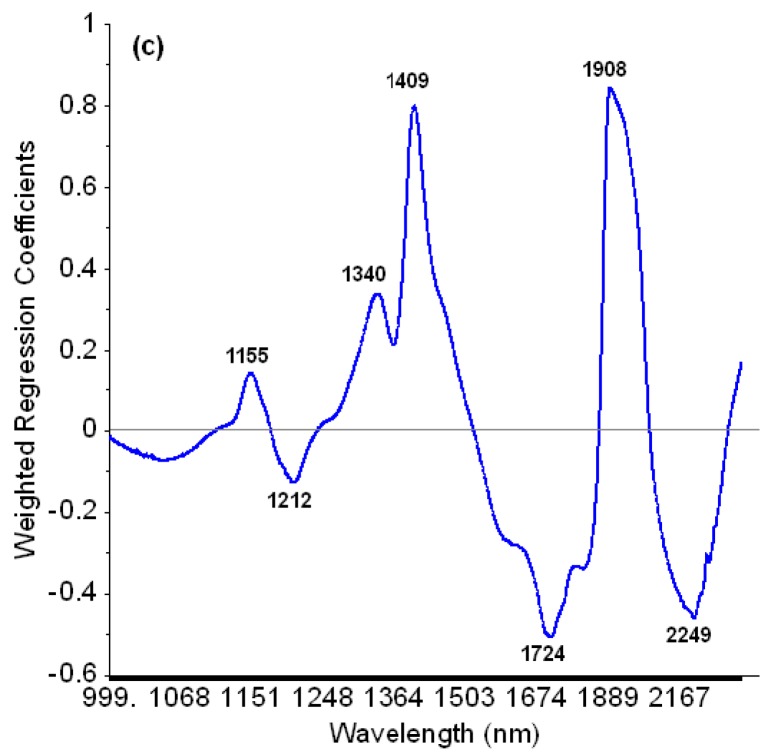
Figure 3.
Score plots of PLSR for moisture content prediction based on raw diffuse reflectance (log 1/R) near infrared spectra. A distinct clustering of Arabica and Robusta coffee samples is observed when displaying PC 1 vs. PC2 (herein: factor-1 and factor-2) (a); Sample allocation is following moisture content indicating the importance of PC 2 and 3 for moisture prediction (b); Weighted regression coefficients obtained from PLSR using raw spectra (c).


