Table 1.
Potent and specific small molecule inhibitors of ATR and CHK1.
| CHK1 Inhibitors | |||
| Name | Structure | IC50/Ki | Specificity |
| AZD7762 | 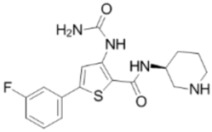 |
CHK1 IC50 = 5 nM | Equally potent: CHK1/CHK2 |
| V158411 | 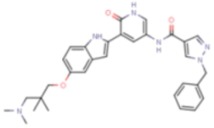 |
CHK1 IC50 = 4.4 nM | Equally potent: CHK1/CHK2; 20-fold CHK1 vs. CHK2 in cells (Cellular CHK1 IC50 = 48 nM vs. CHK2 IC50 = 904 nM) |
| PF477736 | 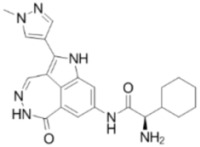 |
CHK1 Ki = 4.9 nM | 100-fold CHK1 vs. CHK2 |
| MK8776/SCH900776 | 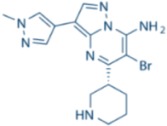 |
CHK1 IC50 = 3 nM | 500-fold CHK1 vs. CHK2 |
| CCT244747 |  |
CHK1 IC50 = 8 nM | >1000-fold CHK1 vs. CHK2 |
| CCT245737 | 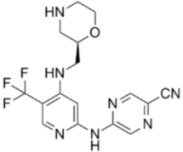 |
CHK1 IC50 = 1.3 nM | >1500-fold CHK1 vs. CHK2 |
| LY2603618 | 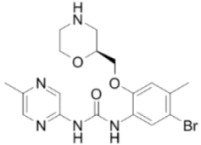 |
CHK1 IC50 = 7 nM | >1500-fold CHK1 vs. CHK2 |
| ATR Inhibitors | |||
| Name | Structure | IC50/Ki | Specificity |
| NU6027 | 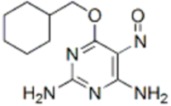 |
ATR IC50 = 1 nM | ATR, CDK1 (Ki = 2.5 µM), CDK2 (Ki = 1.3 µM) |
| ETP-46464 | 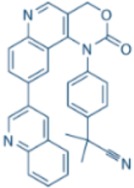 |
ATR IC50 = 25 nM | ATR |
| VE-821 | 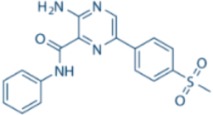 |
ATR IC50 = 26 nM | >100-fold ATR vs. ATM/DNA-PK |
| VE-822/VX-970 | 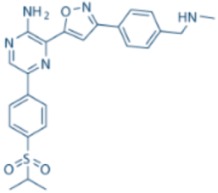 |
ATR IC50 = 0.2 nM | >100-fold ATR vs. ATM/DNA-PK |
| AZ20 | 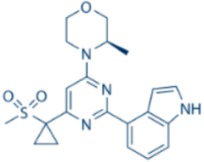 |
ATR IC50 = 5 nM | >600-fold ATR vs. ATM/DNA-PK/PI-3K |
| AZD6738 | 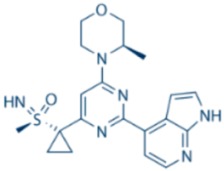 |
ATR IC50 = 1 nM | ATR |
