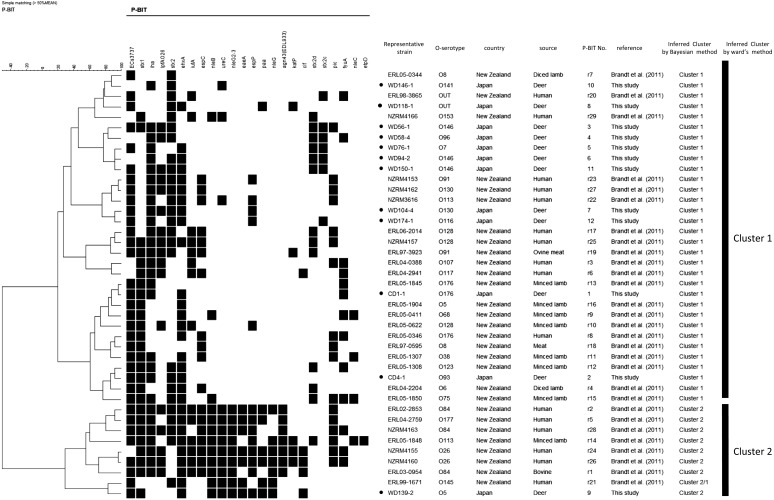
Fig. 1.
Dendrogram of P-BIT analysis using a simple matching coefficient and Ward’s clustering. Deer STEC strains (n=30) and reference STEC strains (n=29) were compared based on the presence or absence of 24 target genes. The presence or absence of these genes is indicated by black and white blocks, respectively. Only the representative strain was included in this dendrogram, if several strains showed the same characteristics, including O-type and P-BIT pattern. Filled black circles in the column of “Representative strain” represent the reference STEC strains derived from deer in Japan.

