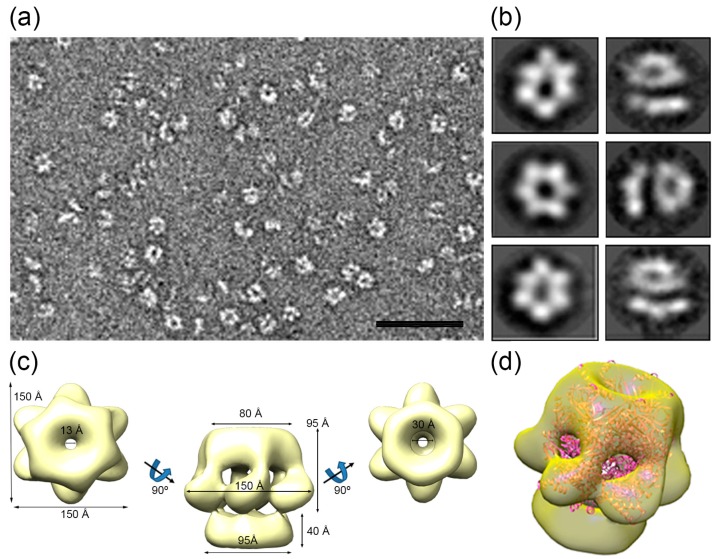
Figure 8.
HepA single-particle electron microscopy reconstruction. (a) Representative electron micrograph of a negatively-stained HepA sample. Bar, 50 nm; (b) six two-dimensional averaged classes of the oligomeric HepA; (c) three-dimensional reconstruction of the hexameric HepA with C6 symmetry; and (d) a semitransparent model of the hexameric HepA with a docked atomic model of the hexameric HerA (pink).

