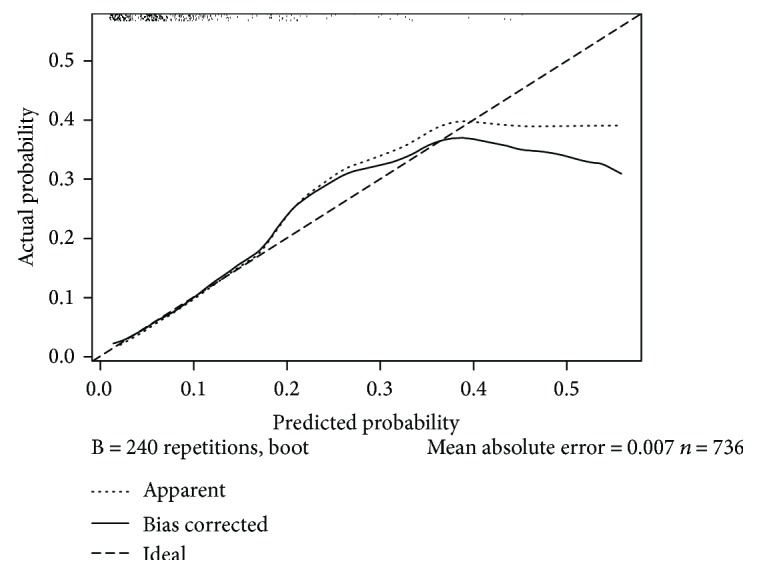
Figure 2.

A calibration plot of the predicted and observed probabilities of anastomotic leakage after laparoscopic rectal cancer surgery. The x-axis indicates the predicted probability of anastomotic leakage, and the y-axis indicates the actual observed rate of anastomotic leakage.
