Figure 2.
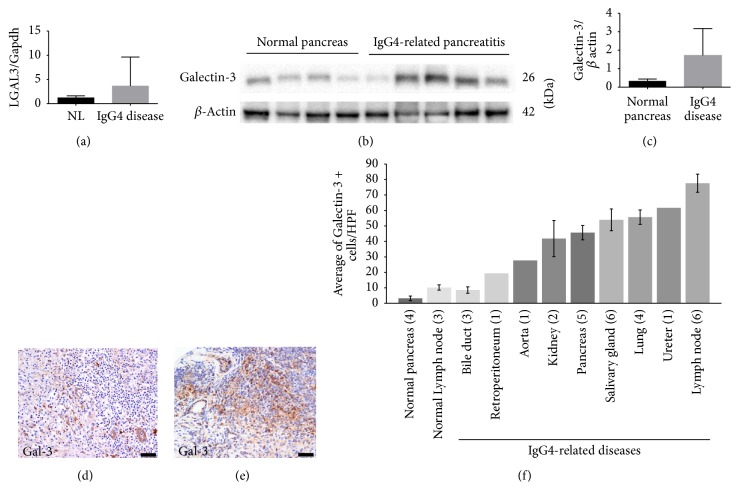
Validation of galectin-3 expression in patients' tissues. (a) LGALS-3 expression was higher in IgG4-related pancreatitis patients compared to controls. Data are presented as the mean relative expression ratio between the mRNA levels of the LGALS3 gene and the expression of GAPDH. Error bars, standard error of the mean (SEM). (b) Immunoblot analysis showing higher galectin-3 protein levels in IgG4-related pancreatitis samples (n = 5) compared with those in the normal pancreas samples (n = 4). (c) Quantification of the immunoblot presented in panel (b). Mean band intensity ratio was measured as intensity of galectin-3 band divided by the intensity of the corresponding beta actin band. Bar graphs represent mean values. Error bars, SEM. (d, e) Immunolocalization of galectin-3 in IgG4-RD samples ((d) pancreas; (e) submandibular gland). Note that lymphoid cells in (d) were negative for galectin-3. Scale bar, 20 μm. (f) Average galectin-3 positive cells in the stroma in different organs in IgG4-RD patients. Positive cells were counted in 3HPF. Numbers in parentheses represent the number of cases. Bar graphs represent mean values. Error bars, SEM.

