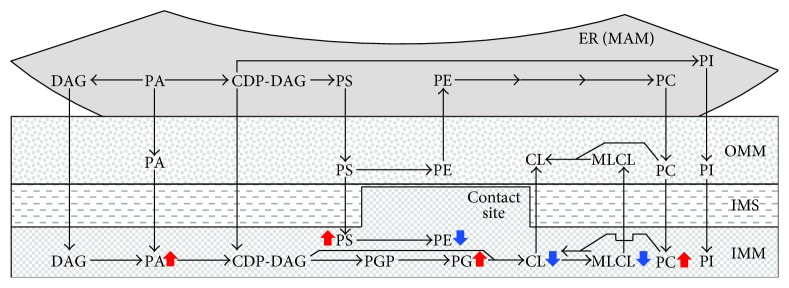
Figure 2.
LCA exhibits differential effects on the relative concentrations of various phospholipid classes in mitochondrial membranes of yeast exposed to this bile acid. Arrows next to the names of individual phospholipids indicate phospholipid classes whose concentrations are increased (red arrows) or decreased (blue arrows) in cells cultured with exogenous LCA and therefore accumulating this bile acid in the IMM and OMM. See text for more details. Abbreviations are as provided in the legend for Figure 1.

