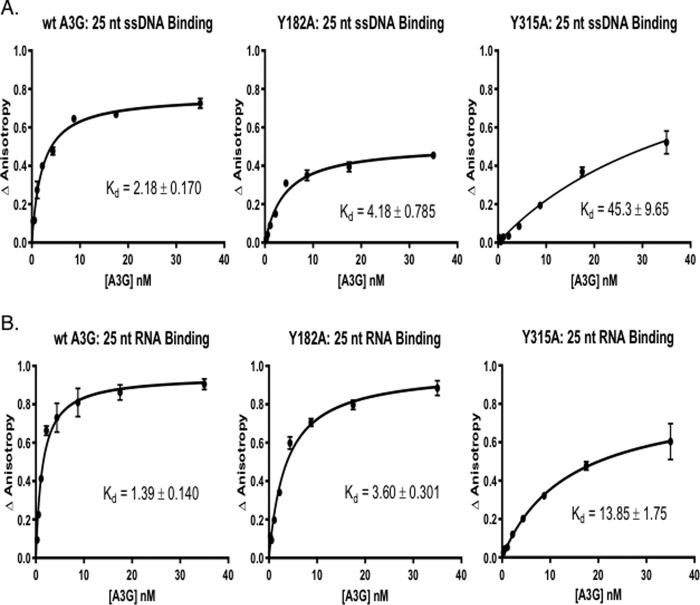
Figure 3.
Binding of A3G tyrosine mutants to AlexaFluor647-labeled nucleic acids is reduced as compared with the WT A3G. Fluorescence anisotropy changes due to A3G binding to AlexaFluor647-labeled 25-nt ssDNA and 25-nt RNA were determined by addition of increasing concentrations of A3G to 2 nm ssDNA (A) or RNA (B) (10). The average normalized change in anisotropy (y axis) of three individual experiments was plotted as a function of protein concentration (x axis), and error bars represent the standard error of the mean (S.E.) of the data. The results were fit to a single-site binding equation accounting for ligand consumption, and A3G dissociation constant (Kd) was determined.

