
Figure 4.
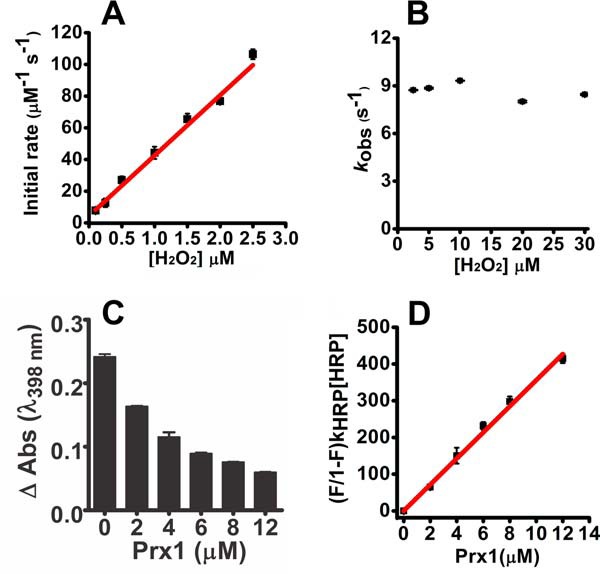
Kinetics of the oxidation of Prx1 by hydrogen peroxide. Pre-reduced Prx1 (5 μm) was incubated with sub-stoichiometric concentrations of hydrogen peroxide (0.1–2.5 μm) in 50 mm sodium phosphate buffer (pH 7.4; 22 °C). The reaction was monitored over time by the variation of intrinsic protein fluorescence (λex = 280 nm, emission filter >330 nm) in the stopped-flow instrument. A, initial rates were calculated from the slope within 10% total fluorescence decay and plotted against hydrogen peroxide concentration. B, observed rate constants (kobs) of the fluorescence increase in the slow phase of the reaction of Prx1 (5 μm) with hydrogen peroxide (2–30 μm) were calculated by single exponential equation and plotted against hydrogen peroxide concentration. C, competition kinetics for the oxidation of Prx1 by hydrogen peroxide. Horseradish peroxidase (HRP, 8 μm) was incubated with sub-stoichiometric concentration of hydrogen peroxide (4 μm) in 50 mm phosphate buffer (pH 7.4; 22 °C) plus 100 μm DTPA. The inhibition in the formation of compound I was dependent on the concentration of Prx1 (pre-reduced Prx1 ∼3.1 μmol of SH·μmol of protein−1). D, linear plot of (F/1 − F)·kHRP·[HRP] versus [Prx1] (slope = kPrx1 = 3.5 ± 0.10 × 10⁷ m−1s−1). Each bar represents the mean ± S.E.M. of three experiments. V, voltage.