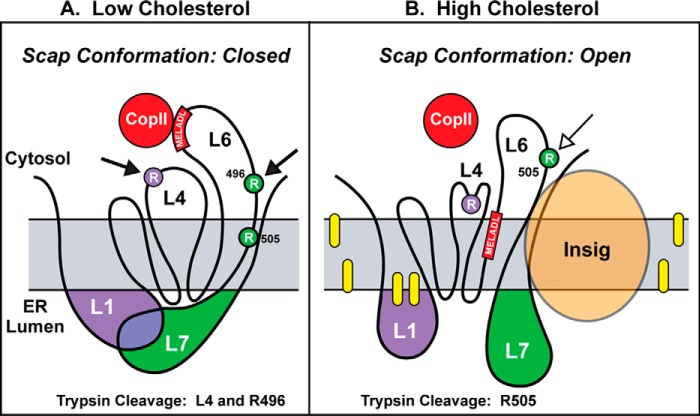
Figure 8.
Model for cholesterol-mediated conformational changes in Scap. A, when ER membrane cholesterol is low, loop 1 and loop 7 exist in a bound, closed conformation, generating the two indicated trypsin cleavage sites (closed arrows). B, when ER cholesterol is high, loop 1 and loop 7 exist in an unbound, open conformation, generating a different trypsin cleavage site (open arrow). Yellow ovals denote cholesterol. Circles denote arginine residues cleaved by trypsin to generate fragments recognized by anti-loop 1 (purple) or anti-loop 7 (green). The red bar denotes the MELADL sequence that targets Scap to COPII-coated vesicles.

