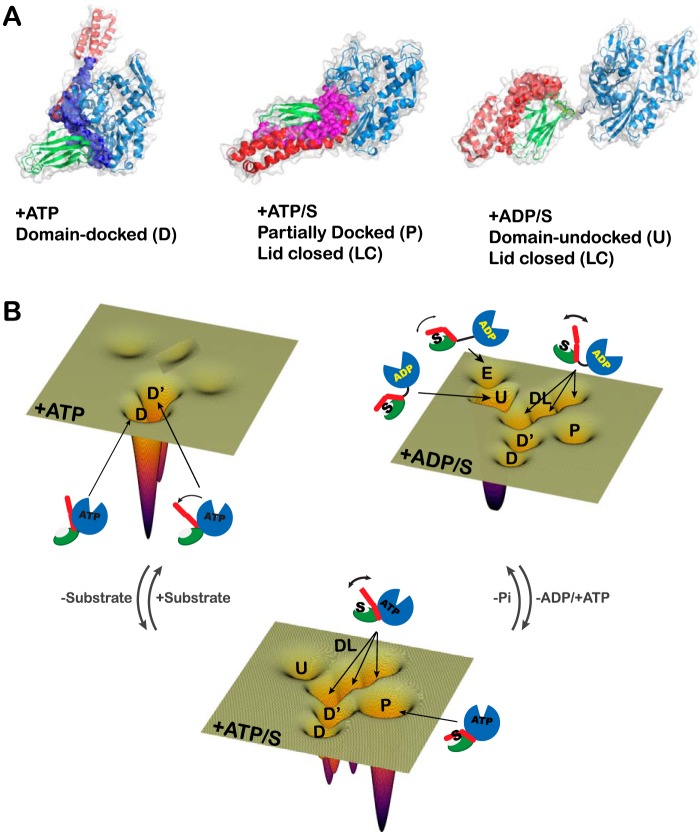
Figure 6.
A, schematic representation of the allosterically active state. Shown is a model of the allosterically active state, where the pink spheres represent the interdomain interface formed between NBD and the linker, and between the α and β subdomains, when ATP and substrate are bound. The backbone of DnaK has been colored as in Fig. 1A. B, schematic representation of the allosteric energy landscape of DnaK under different ligand-bound conditions. The conformations of DnaK under all nucleotide and substrate conditions detected by IMMS and DEER are represented by schematics on an energy landscape. Each energy landscape contains all of the conformations present in the ensemble that were detected by DEER and IMMS. The depth of each conformational energy well is proportional to the relative abundance based on the DEER measurements.

