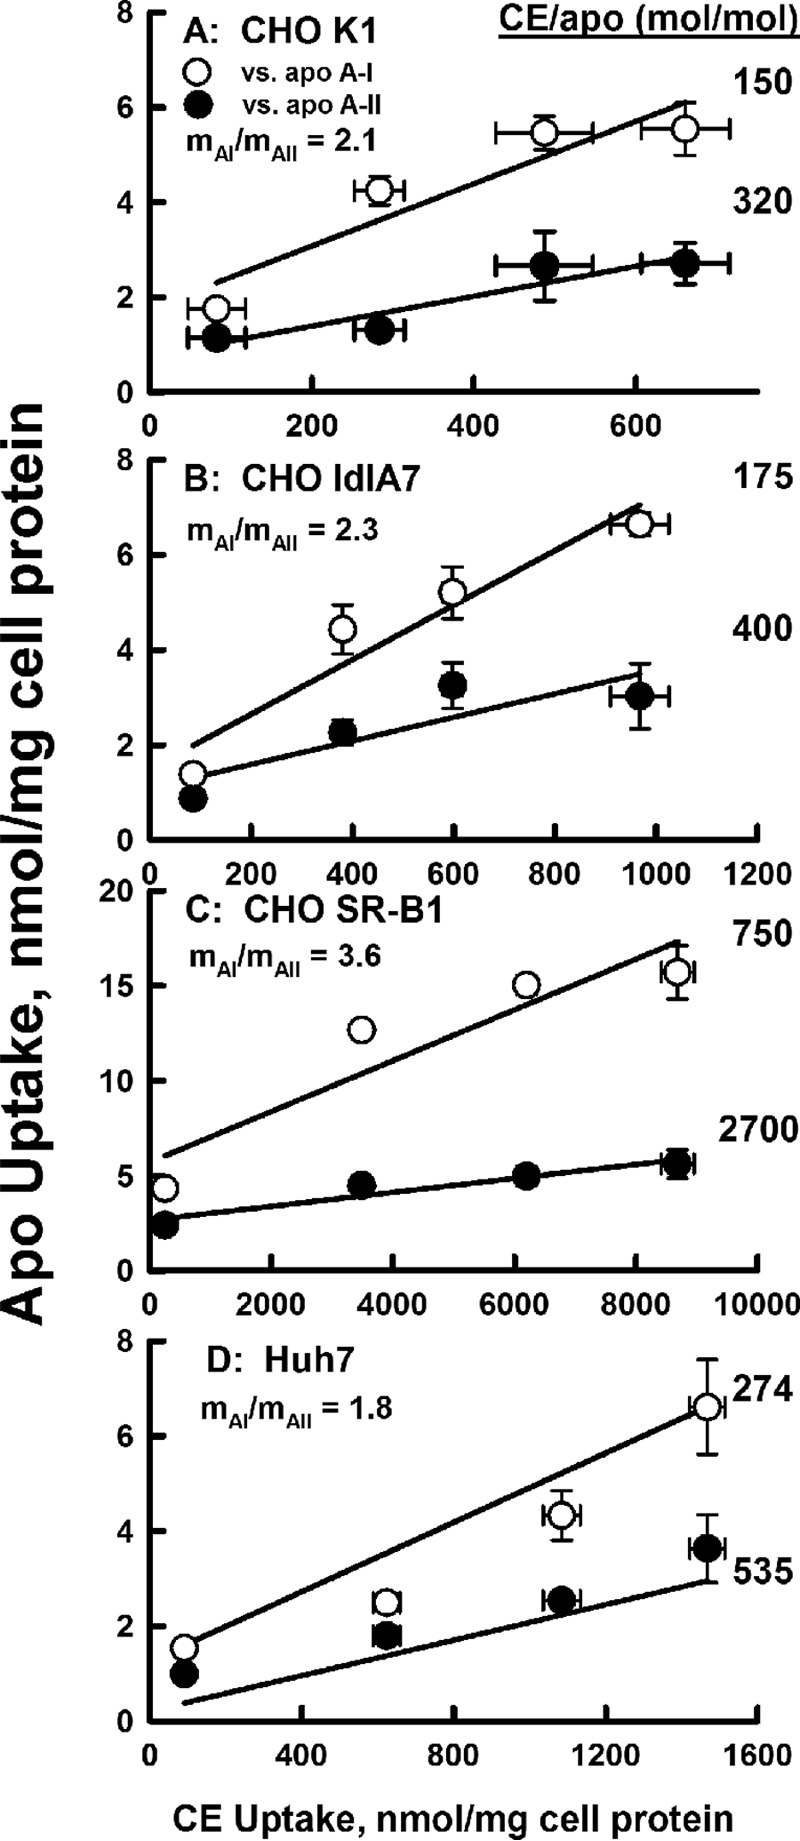
Figure 2.

Selectivity of uptake. ApoAI (white symbols) and apoAII (black symbols) uptake is plotted as a function of CE uptake from the kinetic response data of Fig. 1. The molar ratio of CE to apolipoprotein uptake is calculated as the inverse of the slope of the linear fit to the data points. The relative uptake of apoAI to apoAII (mAI/mAII) is the ratio of the two slopes for a given cell type. The data shown are representative of two independent experiments, each done in triplicate.
