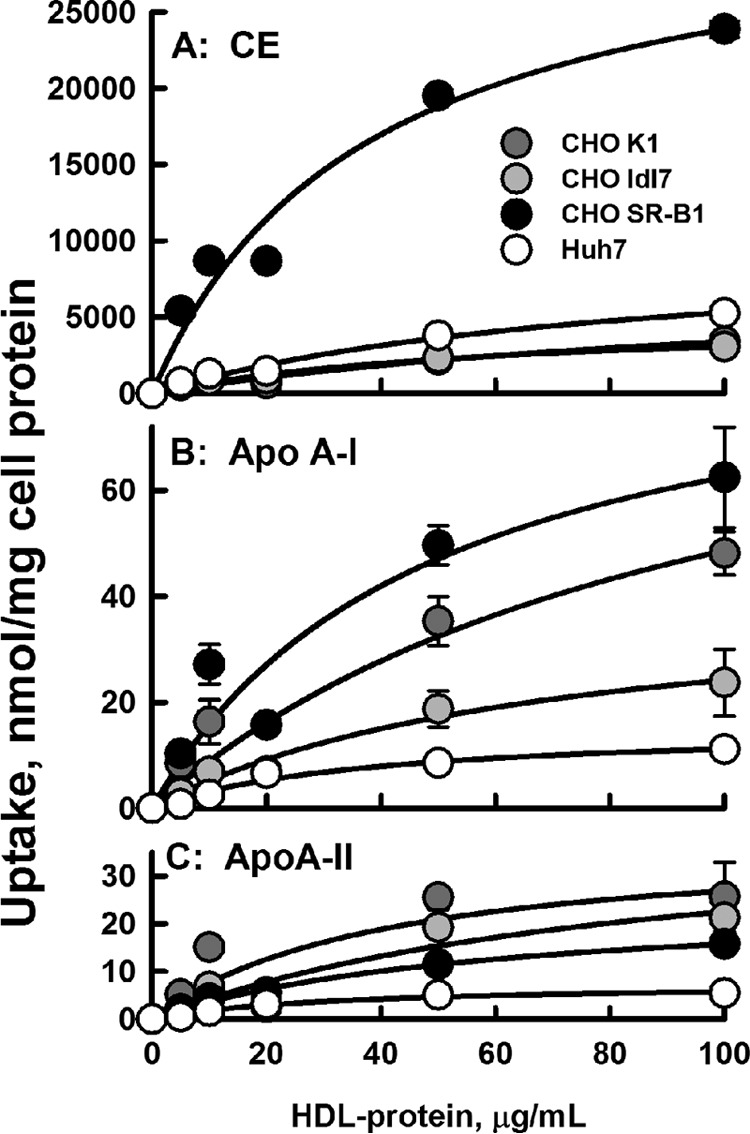
Figure 3.

Dose-response kinetics of uptake. A, HDL-[3H]CE. B, HDL-[125I]apoAI. C, HDL- [125I]apoAII. Dose-response data were fitted to a hyperbolic function, i.e. y = ax/(b + x), where x is HDL-protein concentration, y is the radiolabel uptake, a is the maximum uptake (Vmax), and b is Km, the HDL-protein concentration at 50% of Vmax. The catalytic efficiency E = (Vmax/Km). Data points are the mean ± S.D. for n = 6 for CE and n = 3 for apolipoprotein uptake. All data points have error bars, but some are not visible because they are smaller than the symbols.
