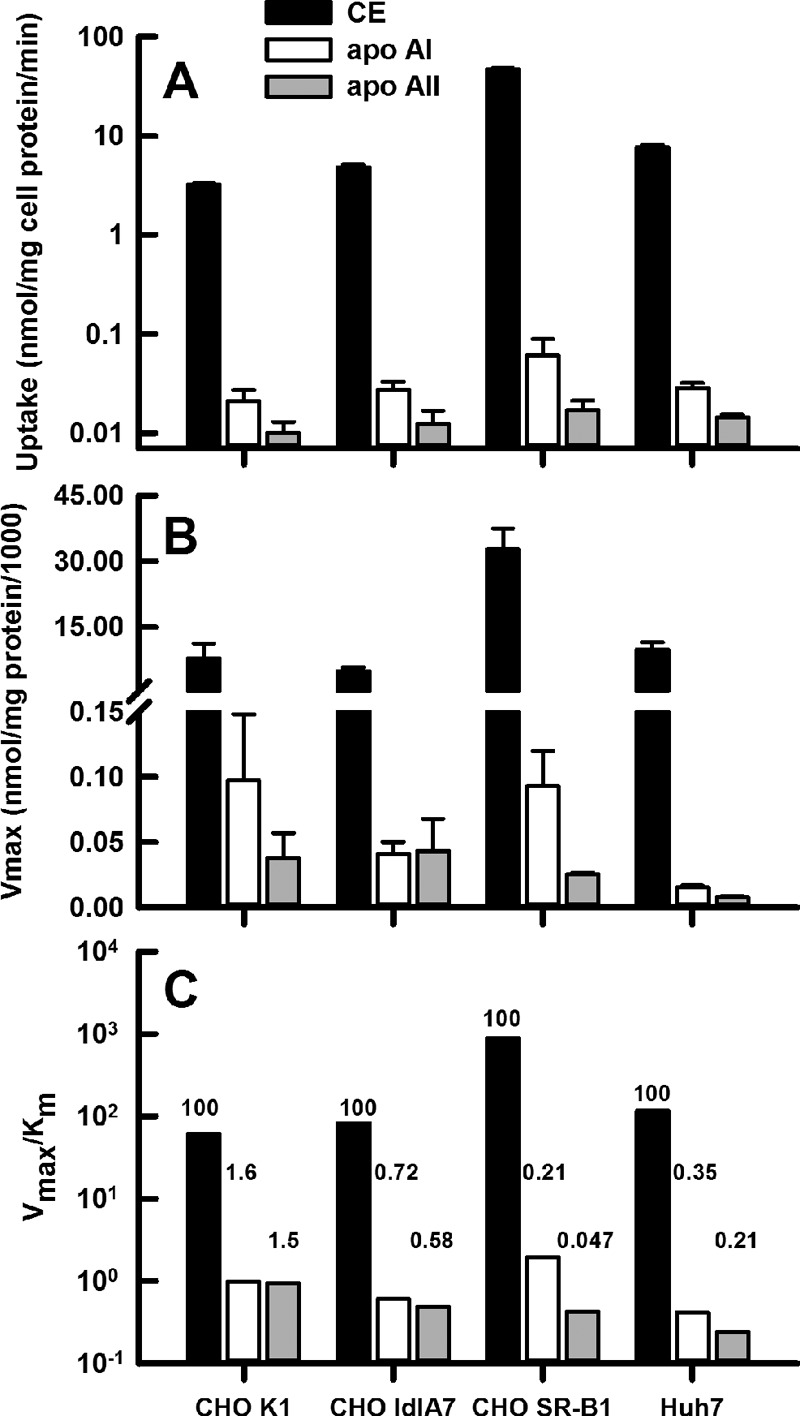
Figure 4.

Kinetic constants for cell uptake of HDL CE (black bars), apoAI (white bars), and apoAII (gray bars). Cell lines are indicated on the x axis. A, rates of uptake, from time course data of Fig. 1. B, Vmax from dose-response data of Fig. 3. C, catalytic efficiency, Vmax/Km, from dose-response data of Fig. 3. Comparison of the molar efficiency of uptake for CE versus apoAI and apoAII are indicated by the numbers above the bars, with efficiency of CE uptake = 100 and the relative apoAI and apoAII uptake as shown for each cell line.
