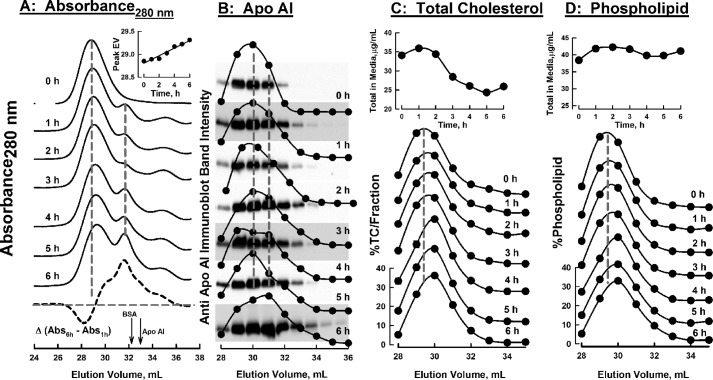
Figure 5.
Change in SEC profile of various HDL analytes in culture media over time during incubation of HDL with CHO-SR-B1 cells. Media were concentrated and passed over Superose HR6 columns, and the absorbance (280 nm) was measured (A), and fractions were collected and analyzed for apoAI by immunoblotting (B), total cholesterol (C), and phospholipid (D). Time of incubation is indicated on each chromatogram. TC, total cholesterol (sum of CE + FC). The plot at the bottom of panel A is the difference in the SEC absorbance profiles at t = 1 and 6 h; arrows denote the EVs of BSA and apoAI. The inset in A shows the shift in the peak EV over time. Immunoblots in panel B are overlaid on the plots of their band intensities in the same top-to-bottom order. Dashed vertical gray lines denote prominent peaks at initial t = 0 or 6 h. Insets at the tops of C and D are the changes in the total media cholesterol and phospholipid over time. Dashed vertical lines are to facilitate comparison of curves.

