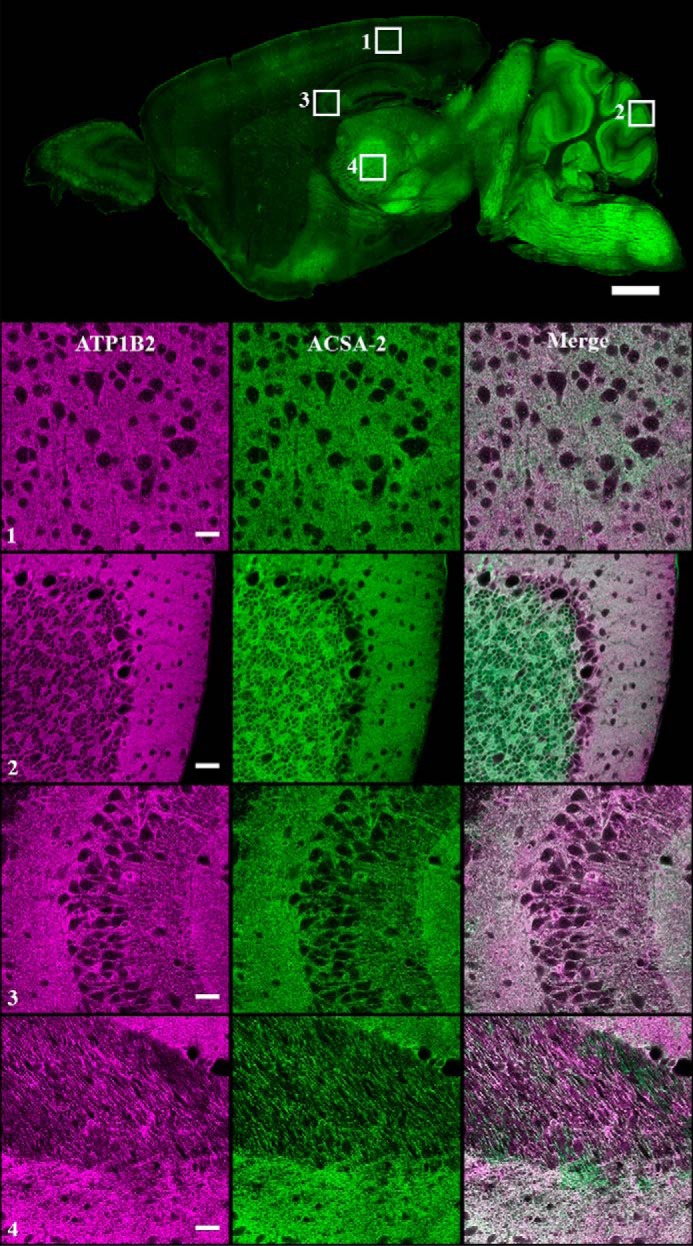
Figure 8.

Colocalization of ACSA-2 and ATP1B2 signals in mouse brain. ACSA-2 was used to stain sagittal sections of mouse brain. A low-magnification widefield image taken on a slide scanner (top) shows ACSA-2 to be expressed throughout the brain at various levels. To accurately assess the degree of ATP1B2 and ACSA-2 colocalization, a laser-scanning confocal microscope was used to take images at higher magnification in four different brain regions indicated by the numbered white boxes (1, visual cortex; 2, cerebellum; 3, CA3 region of the hippocampus; 4, thalamus). ATP1B2 (magenta) and ACSA-2 (green) show nearly perfect overlap (bottom panels). For all images, acquisition parameters were individually optimized for maximum dynamic range to allow easier visualization of protein localization. Tissue sections from three animals were analyzed with the same results. Scale bars, 1000 μm (low magnification) and 30 μm (high magnification).
