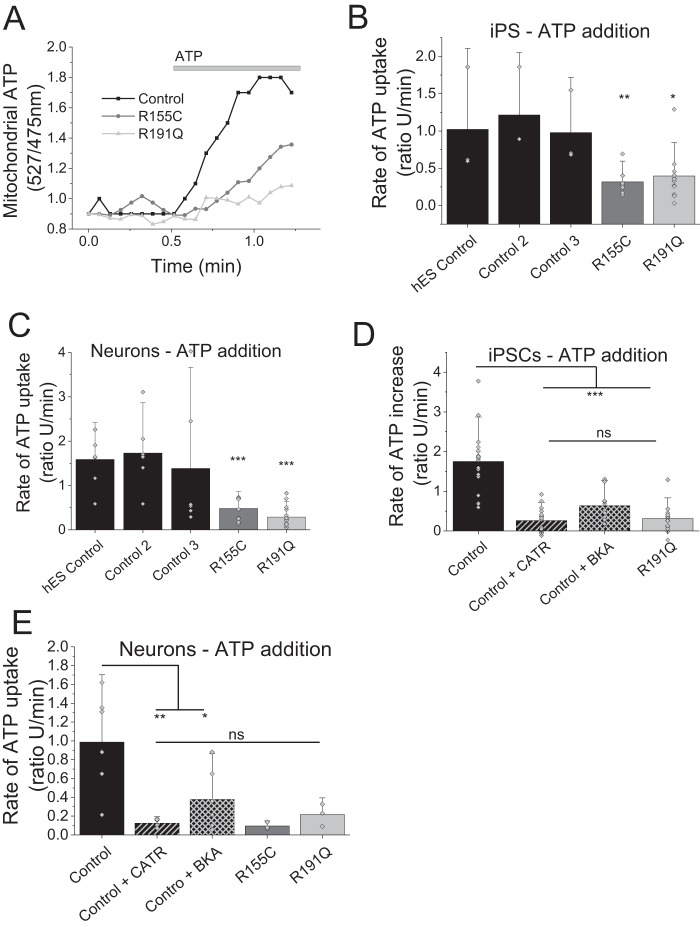
Figure 5.
A, representative traces of mitochondrial ATP uptake. B, quantification of the rate of ATP uptake in control and VCP mutation bearing iPS cells. C, quantification of the rate of ATP uptake in control and VCP iPS-derived neurons. D, quantification of the rate of ATP uptake in control iPSCs or pre-exposed to ANT inhibitors (BKA/ATRAC) as well as mutation bearing iPSCs. E, quantification of the rate of ATP uptake in control neurons, neurons pre-exposed to ANT inhibitors (BKA/ATRAC), and mutations bearing neurons. *, p < 0.05; **, p < 0.01; ***, p < 0.001.

