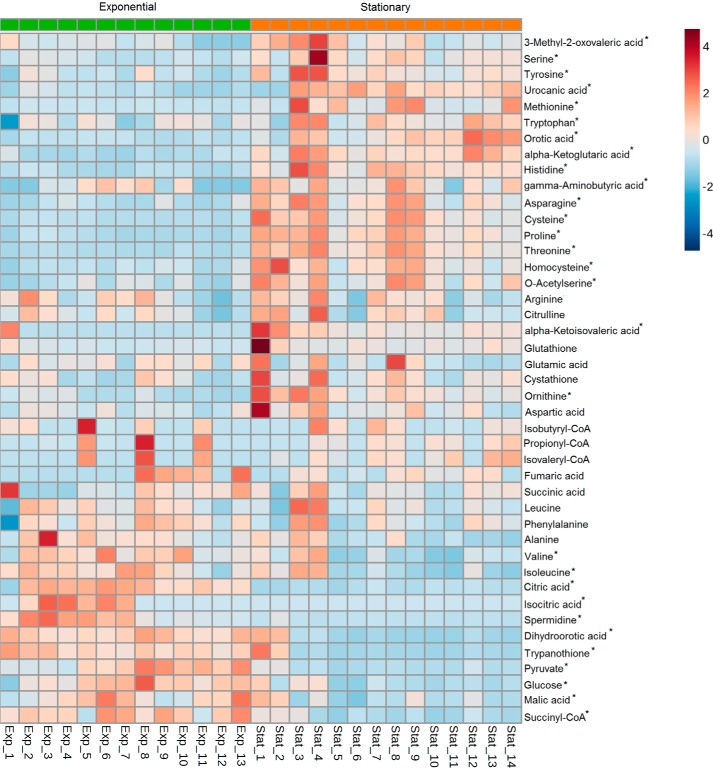
Figure 3.
Heat map of metabolites detected in T. cruzi epimastigotes from selected metabolic pathways. Each line represents a metabolite detected by LC/MS-MS analysis, and values are represented as the metabolite/internal standard area ratio of MS signals detected by MRM normalized to the cell numbers. Columns represent each technical replicate from seven independent experiments in exponential phase (green labeled on the top-left side) and stationary phase (orange labeled on the top-right side). *, metabolites that presented a significant difference between exponential and stationary phases according to the Benjamini and Hochberg test (supplemental Table S2). The colors vary from deep blue (very low data value) to dark brown (extremely high data value).

