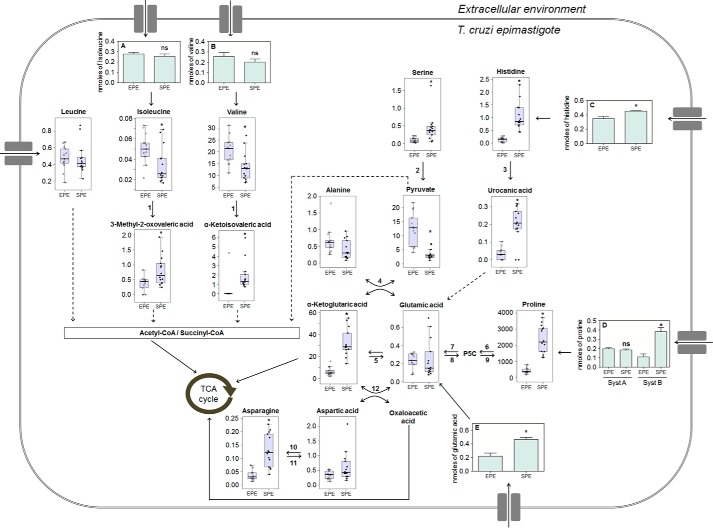
Figure 5.
Metabolic network of selected amino acids and their intermediates in EPE and SPE phases of T. cruzi epimastigotes. Transport of amino acids are represented by light green bars, and values correspond to nanomoles of Ile (A), Val (B), His (C), Pro (D), and Glu (E) incorporated by 2.0 × 10⁷ parasites in EPE and SPE. Values of metabolite levels correspond to the metabolite/internal standard area ratio of MS signals detected by MRM normalized to the cell numbers. * indicates metabolites with a significant difference between EPE and SPE according to the Benjamini and Hochberg test (supplemental Table S2). Differences in the transport of amino acids were found as statistically significant by using unpaired Student's t test (proline System B p < 0.001, histidine p < 0.041, glutamate p < 0.01). N.S. indicates that no significant variation was observed in the transport of the corresponding amino acid. Dashed arrows represent more than one enzymatic reaction. Numbers indicate the corresponding enzymes: 1, tyrosine aminotransferase; 2, serine/threonine dehydratase; 3, histidine ammonia-lyase; 4, alanine aminotransferase; 5, glutamate dehydrogenase; 6, proline dehydrogenase; 7, pyrroline-5-carboxylate dehydrogenase; 8, pyrroline-5-carboxylate synthetase; 9, pyrroline-5-carboxylate reductase; 10, asparagine synthetase; 11, asparaginase; 12, aspartate aminotransferase.

