
Figure 2.
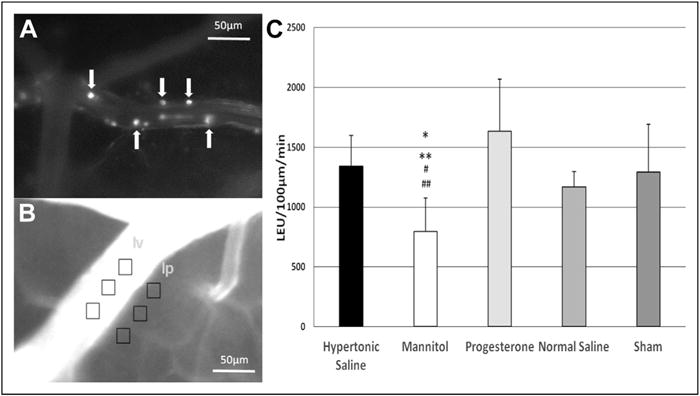
(A) Representative image of the pial microcirculation. White arrows indicate leukocytes rolling on the endothelium. (B) Representative image after FITC–albumin injection. Light intensity (gray) was measured within the vessel (Iv) and outside the vessel (Ip), where vascular permeability was calculated as mean Iv/mean Ip. (C) Leukocyte rolling on endothelium 32 hours after TBI. Scale bar = 50 μm. *P = .01 vs hypertonic saline, **P = .004 vs progesterone, #P = .02 vs normal saline, and ##P = .04 vs Sham.