
Figure 3.
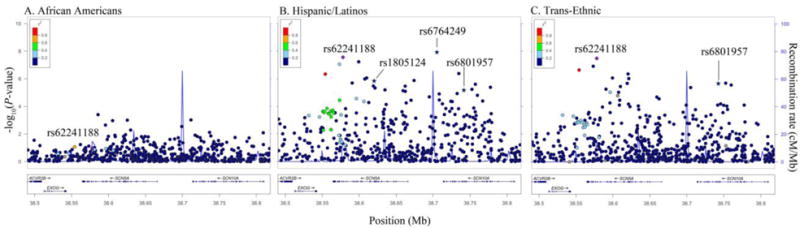
Racial/ethnic-specific and trans-ethnic regional association plots for SCN5A/SCN10A. Population-specific log10P-values (left y axis) are plotted against the SNP genomic position (NCBI build 36, x axis); the estimated recombination rate from the 1000 Genomes project is shown in blue on the right y axis. Lead SNPs are denoted with a purple diamond. SNPs are colored to reflect population-specific r2 with the lead SNP. Novel SNPs are denoted by vertical lines and stars.