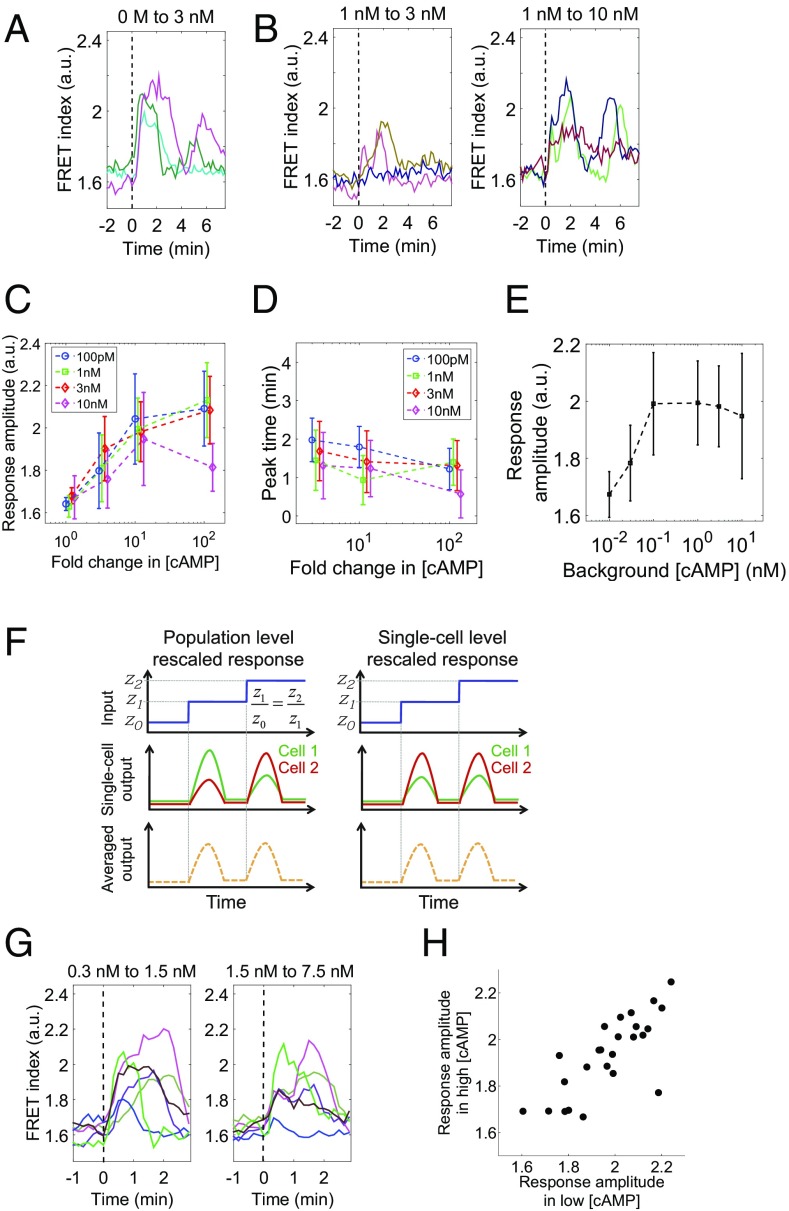
Fig. 2.
The cAMP relay response at the single-cell level obeys fold-change detection. (A and B) The concentration of perfused cAMP was changed from 0 to 3 nM (A), 1 to 3 nM (B; Left), and 1 to 10 nM (B, Right). The dotted lines indicate the time of stimulus switch. Colors indicate different cells. (C and D) The peak amplitude (C) and the response time (D) of the response; priming concentrations, 0.1 nM (blue), 1 nM (green), 3 nM (red), and 10 nM (magenta) cAMP. The vertical axis: the maximum FRET index during the 4 min after the input change (C) and the time it took for the FRET index to reach the initial peak (D). Dots and error bars indicate the mean and SD (n = 11, 16, 16, and 15 for 1-, 3-, 10-, and 100-fold change from 100 pM, respectively. In the same way, n = 13, 23, 15, and 16 for 1 nM; n = 11, 13, 11, and 14 for 3 nM; n = 16, 7, 10, and 9 for 10 nM). (E) The amplitude of the response to 10-fold increase in the extracellular cAMP concentration. Error bars indicate SD (n = 10, 14, 16, 15, 11, and 10 for 10−2, 3 × 10⁻², 0.1, 1, 3, and 10 nM, respectively). (F) Two possible scenarios for the curves in C. (Left) The response sensitivity is heterogeneous and not rescaled at the single-cell level. (Right) The response sensitivity rescales at the single-cell level. (G) Representative responses to sequential fivefold step inputs from 0.3 to 1.5 nM (Left), and then from 1.5 to 7.5 nM (Right). Colors are mapped to identify individual cells consistently in two panels. Cells were kept at 1.5 nM cAMP for 15 min before the second increment. (H) A scatter plot of the response amplitude to two incremental step inputs; correlation coefficient, 0.68 (n = 25).

