Fig. 3.
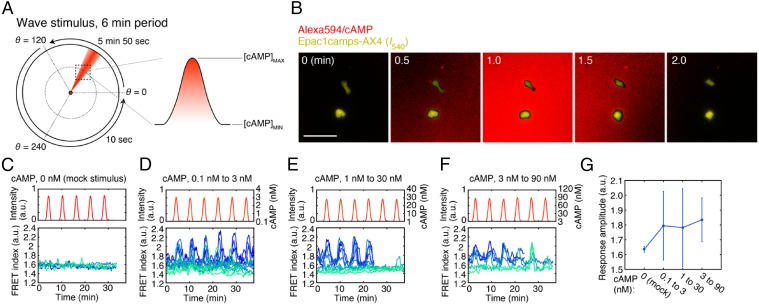
The cAMP relay response to traveling-wave stimuli. (A) Application of a traveling-wave stimulus using the lighthouse device (33). A schematic of generating periodically rotating waves at 6-min period (Left). Due to diffusion, a bell-shaped gradient forms perpendicular to the flow of buffer solution containing high concentration of cAMP (red). The orientation of the stimulus flow was varied at the rate of 0.34°/s anticlockwise from θ = 0° to 120°, thereby allowing a bell-shaped gradient to traverse the observation area (dotted square). For the remaining region from θ = 120° to 360°, the rotation was fast-forwarded by switching the direction discretely in two steps from 120° to 240°, and then 240° to 360° (33). Alexa Fluor 594 was included in the stimulus solution to estimate the spread of cAMP. For each run of experimental observation, the rotation was cycled four to six times. (B) Merged confocal images of the stimulus profile (red; Alexa) and Epac1camps/AX4cells [yellow; YFP (I540nm) channel] during a wave passage. (Scale bar, 50 µm.) (C–F) cAMP response to the wave stimulus. cAMP concentrations: mock (C; n = 5 cells), 0.1–3 nM (D; n = 12 cells), 1–30 nM (E; n = 10 cells), and 3–90 nM (F; n = 6 cells). Temporal profiles of the wave stimulus (Upper) and individual cell responses (Lower; graded blue green colors indicate different cells). Buffer solution containing Alexa Fluor 594 without cAMP was used for the mock control (C). cAMP concentrations were estimated from the fluorescence intensity of the Alexa dye (D–F). (G) The average peak FRET index. Error bars indicate SDs.

