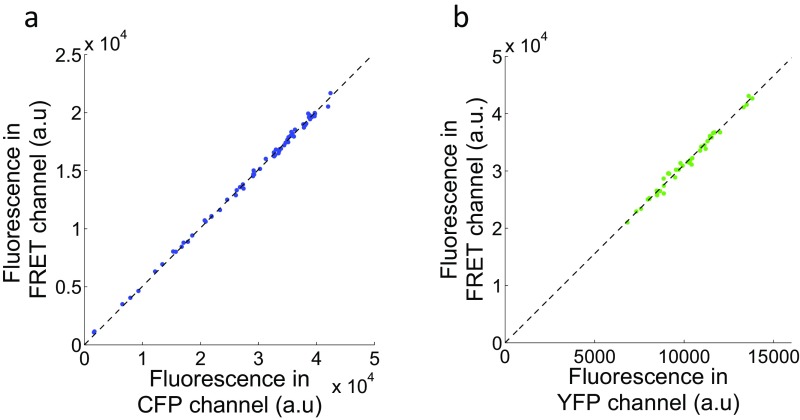
Fig. S1.
Determination of the coefficients to correct for channel cross talk and cross-excitation. (A) Plots of the background-subtracted mean fluorescence intensities in the CFP and FRET channels obtained from CFP-expressing cells excited with 435-nm light. Dots represent measurements from individual cells. The dashed line marks the least-squares regression line (IFRET = 0.5ICFP). (B) YFP-expressing cells were excited with 435-nm light and 500-nm light for YFP channel, and the mean fluorescence intensities were plotted after background correction. The least-squares regression line is represented by the dashed line (IFRET = 3.1IYFP).

