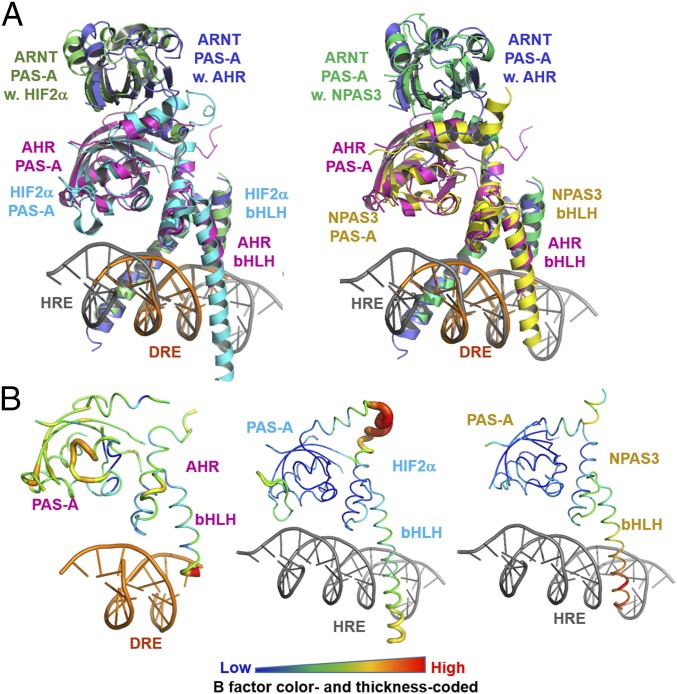
Fig. 4.
Comparison of structures of AHR–ARNT–DRE, HIF–2α-ARNT–HRE, and NPAS3–ARNT–HRE complexes. (A) Overall view of the overlay of the HIF-2α–ARNT–HRE and AHR–ARNT–DRE complexes (Left) and NPAS3–ARNT–HRE and AHR–ARNT–DRE complexes (Right). AHR is colored magenta; HIF-2α, cyan; NPAS3, yellow; DRE, orange; and HRE, gray. ARNT in complex AHR, HIF-2α, and NPAS3 are colored slate, lime, and green, respectively. (B) Structures of AHR, HIF-2α, and NPAS3 in worm with the color and thickness reflecting the scale of the B factors.

