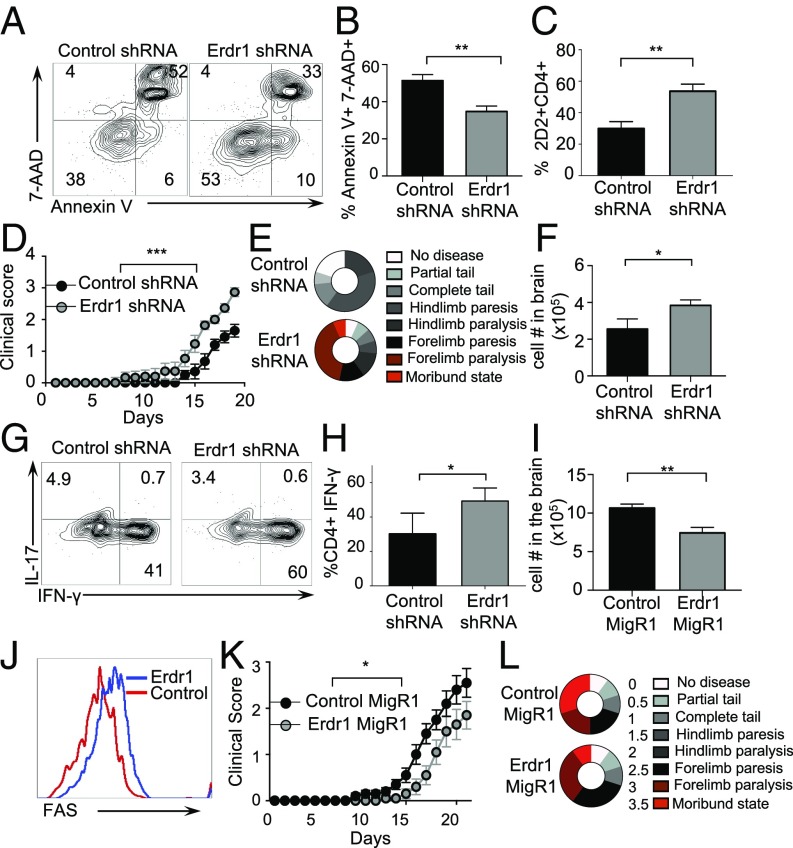
Fig. 5.
Erdr1 effects on T-cell survival influence extraintestinal autoimmunity. (A–H) The indicated 2D2 T cells were transferred into Rag−/− animals and EAE-induced. (A) Representative flow cytometry plots of Annexin V and 7AAD. (B) Compiled plots from splenic cells. n = 7–9/group from three experiments. (C) Percentage of CD4+ T cells isolated from spleens. n = 9/group from three experiments. (D and E) Clinical symptoms of disease are shown. ***P < 0.005 by two-way ANOVA statistical test. n = 9/group. Data were compiled from three experiments. (F) Total number of infiltrating lymphocytes in the brains of indicated animals. n = 4–5/group representative of three experiments. (G and H) Representative plots of brain infiltrating IL-17 and IFN-γ from T cells. n = 4–5/group representative of three trials. (I–L) The indicated 2D2 T cells were transferred into Rag−/− animals, and EAE was induced. (I) Number of total lymphocytes isolated from the brains of animals. n = 9–10/group. (J) Representative plot of Fas staining from the brains of animals. Data were compiled from two experiments. (K and L) Animals were monitored for signs of paralysis for 21 d. n = 9–10/group representative of two experiments. *P < 0.05 by two-way ANOVA statistical test. Data were compiled from two experiments. *P < 0.05, **P < 0.01, and ***P < 0.005 by Student’s t test unless otherwise indicated.

