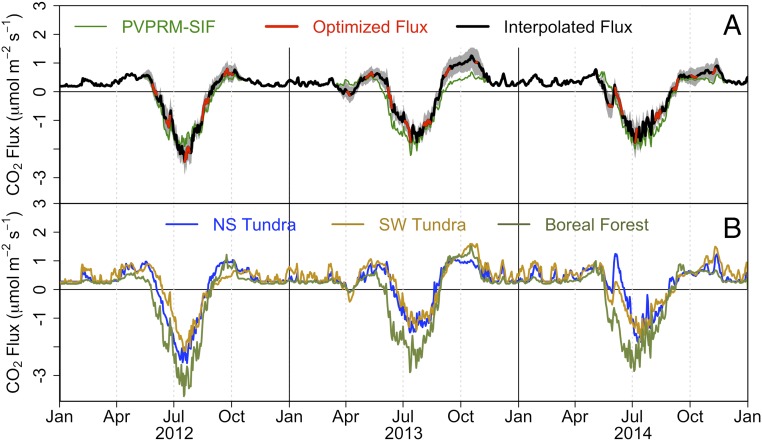
Fig. 1.
Time series of biogenic CO2 fluxes for Alaska during 2012–2014 calculated from CARVE aircraft data. (A) Mean daily net biogenic CO2 flux for Alaska during 2012–2014, with modeled (PVPRM-SIF) CO2 flux (green) and the aircraft optimized net CO2 flux (red) and interpolated aircraft optimized net CO2 flux (black). Our approach for estimating these fluxes and the uncertainty range (shown with shading) is described in SI Appendix, Calculation of the Additive Flux Correction. (B) Optimized biogenic CO2 fluxes for different regions in Alaska: NS tundra (blue), SW tundra (orange), and boreal forests (green).

