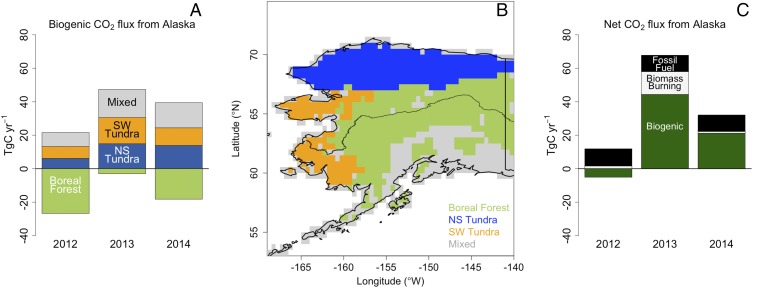
Fig. 2.
CO2 budget for Alaska 2012–2014. (A) Net biogenic carbon budget for boreal forests (light green), Yukon−Kuskokwim Delta of southwest Alaska and the Seward Peninsula to the west (SW tundra) (orange), NS tundra (blue), and the mixed areas or areas of Alaska not included in other regions (gray) (in teragrams of carbon per year) calculated from the aircraft optimized CO2 flux for 2012, 2013, and 2014. (B) Map of the regional areas described in A. Negative fluxes indicate uptake of CO2 by the biosphere. (C) Net carbon fluxes for Alaska during 2012–2014 from biogenic (dark green), biomass burning (white), and fossil fuel (black) components.

