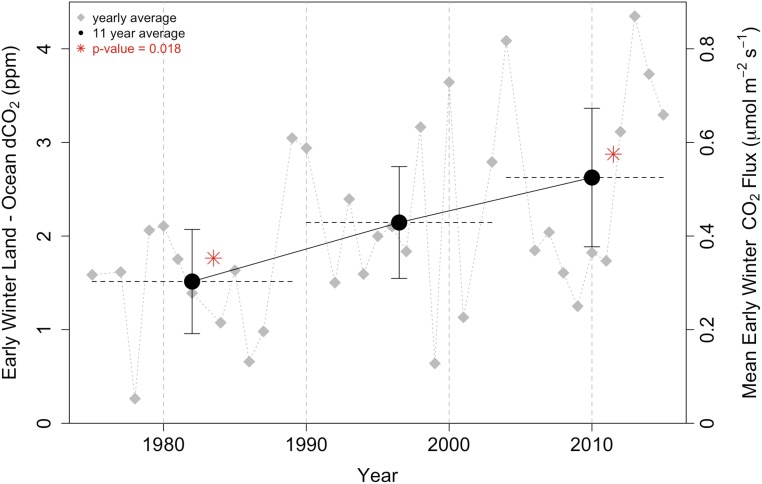
Fig. 3.
Early winter (October through December) land−ocean sector CO2 signal (dCO2) measured at the NOAA BRW tower in Barrow, AK, since 1975. The tower is influenced by a large area of the North Slope. The early winter land sector dCO2 has increased by 73.4% ± 10.8% at BRW over 41 y [1.51 ± 0.64 ppm in 1975–1989 to 2.62 ± 0.85 ppm in 2004–2015, a statistically significant increase with P value 0.018, indicated by red asterisks (*)]. Shown are the yearly averaged data (gray diamonds) and 11-y average (black circles) with 95% confidence intervals (error bars) and dashed lines to indicate the years sampled. Using the fluxes calculated as part of the aircraft optimization, the mean flux of CO2 on the North Slope has increased by a comparable amount, from 0.24 μmol⋅m−2⋅s−1 in 1975–1989 to 0.43 μmol⋅m−2⋅s−1 in 2004–2015.

