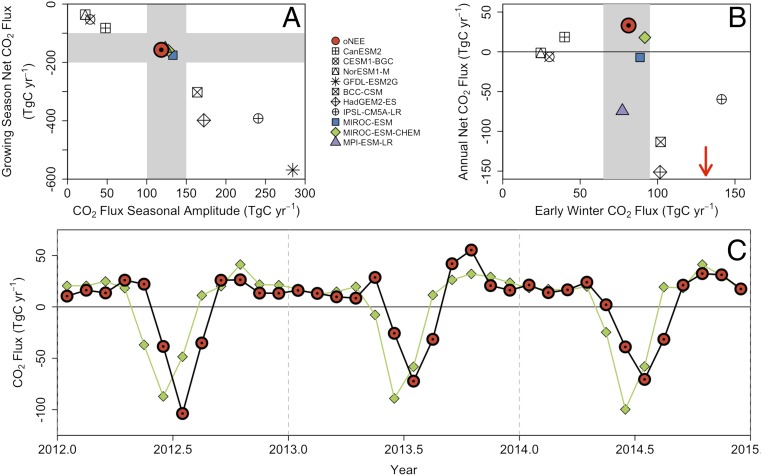
Fig. 4.
CMIP5 ESM behavior compared with the monthly mean optimized CO2 flux from our analysis. (A) Growing season net CO2 flux (in teragrams of carbon per year) against the CO2 flux seasonal amplitude (in teragrams of carbon per year) indicate three model groupings. (B) Annual net CO2 flux (in teragrams of carbon per year) against early winter (September through December) CO2 flux. The arrow indicates the early winter flux of the GFDL-ESM2G model (annual net flux is −328 TgC⋅y−1). (C) Time series of CO2 flux for the model with the closest matching carbon fluxes in A and B (MIROC-ESM-CHEM) and the aircraft optimized CO2 flux. The modeled peak carbon uptake in summer is too large and a month too early compared with the aircraft optimized CO2 flux. Negative fluxes represent uptake by the biosphere.

