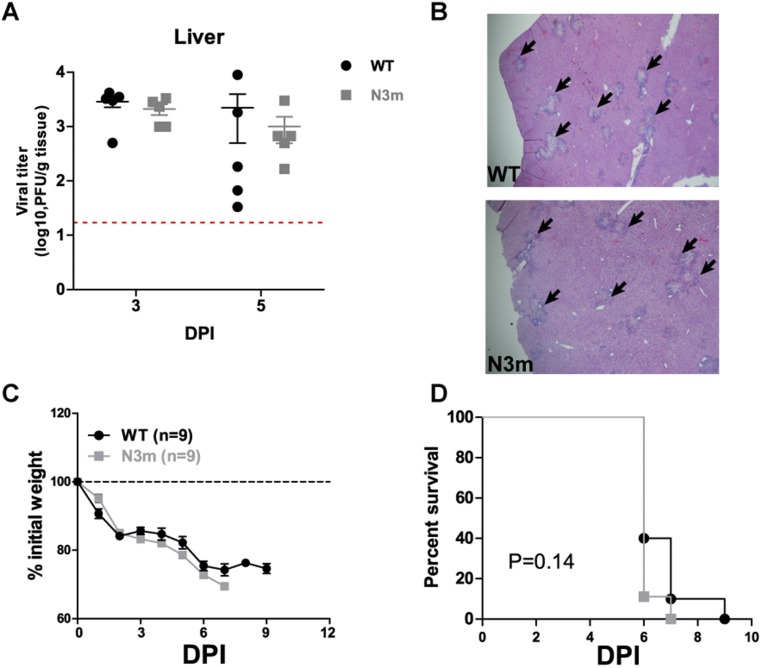
Fig. S7.
N3m virus phenocopies WT virus in mouse infection. (A and B) Six-week-old C57BL/6 mice (five mice per group) were intraperitoneally inoculated with 6.0 × 10⁴ pfu of virus. (A) Viral titer in liver at 3 and 5 dpi was determined and (B) liver pathology at 5 dpi was evaluated by H&E staining. (Magnification, 40×.) Black arrowheads indicate the liver lesions caused by MHV infection. Red dash line indicates the limit of detection. (C and D) Six-week-old C57BL/6 mice were intracranially injected with 600 pfu of WT or mutant viruses. Viral pathogenicity was evaluated by (D) body weight loss and (E) survival rate. Data are a pool of two independent experiments. Error bars in A and C represent the mean ± SEM P value of survival rate was calculated using a log-rank test.

