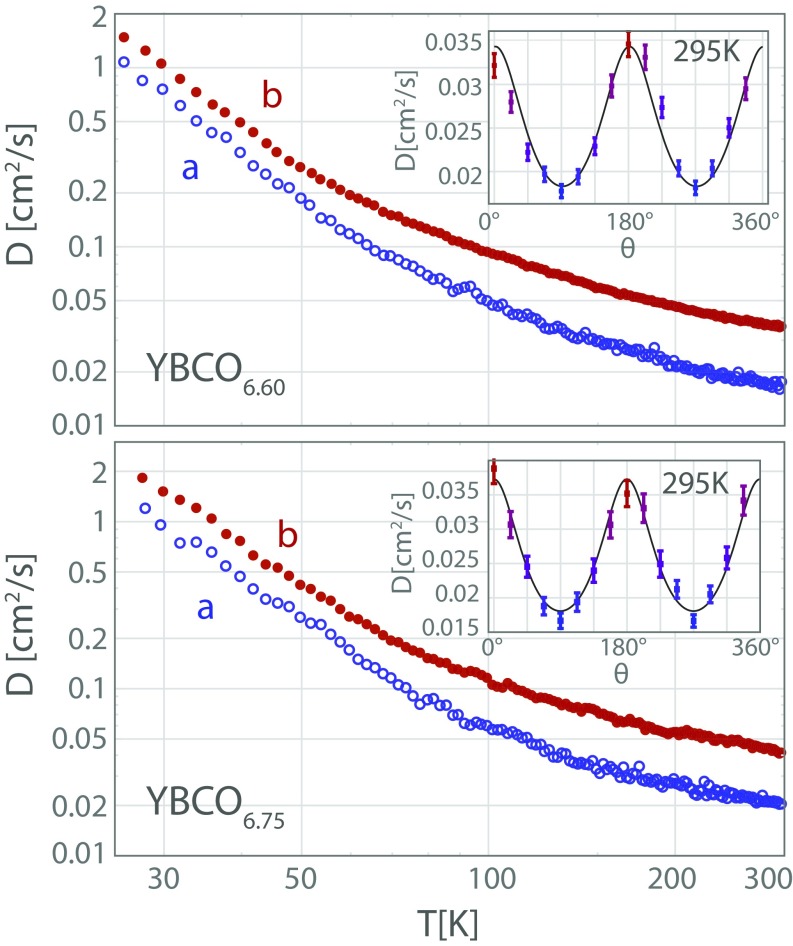
Fig. 1.
Thermal diffusivity of YBCO6.60 and YBCO6.75 single crystals extracted from phase measurements along a (blue) and b (chain direction, red) axes, and plotted on a log–log scale as a function of temperature in the range 25–300 K. Insets show diffusivity measured at RT as a function of orientation around the heating spot, with the solid lines representing fits to Eq. 1. Error bars are almost entirely caused by uncertainty in determining lasers spots separation.

