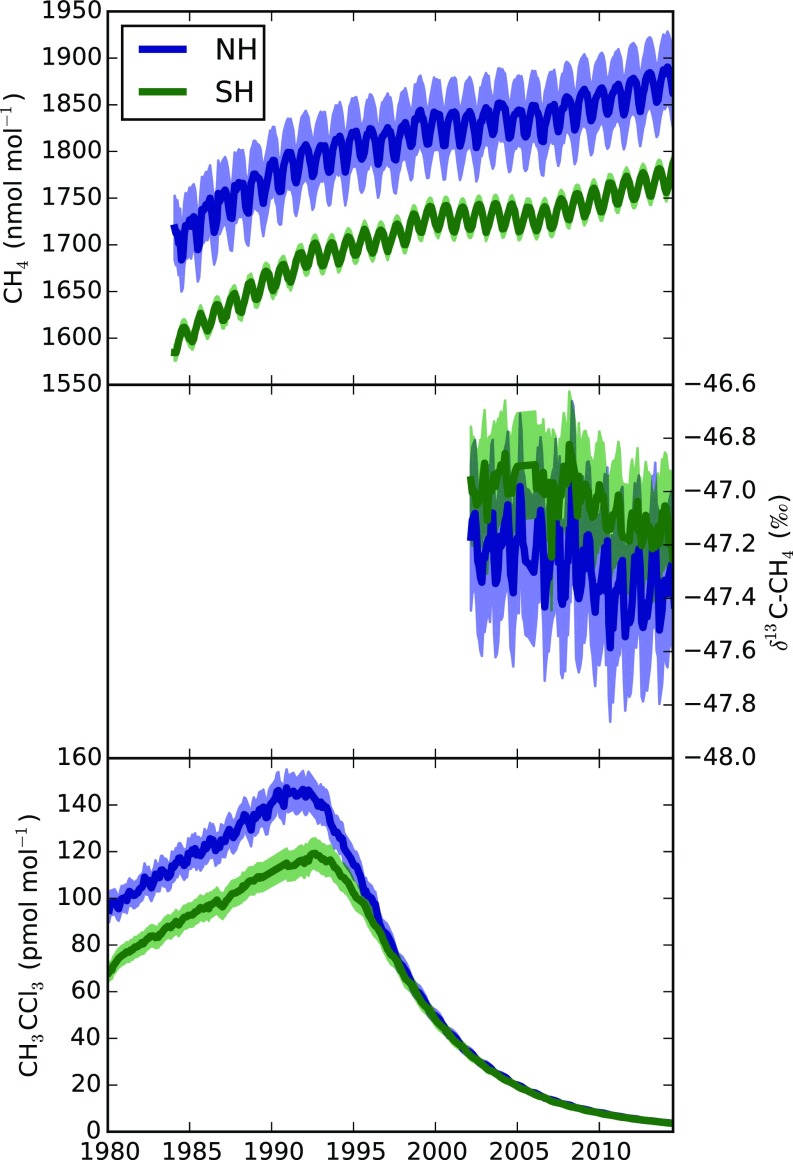
Fig. 1.
(Top) NOAA observations of CH4. (Middle) INSTAAR observations of δ13C-CH4. (Bottom) The AGAGE observations of CH3CCl3. Each plot shows the northern hemisphere (NH) and southern hemisphere (SH) means, and shading indicates the assumed 1-sigma model and measurement uncertainty as defined in SI Materials and Methods.

